

We are used to traditional software that tends to fail loudly. A service throws an exception, or a request returns a 500. We see error rates climbing visibly. AI agents, however, don’t typically work that way.
An agent can keep returning confident, well-formed answers while it gets less and less accurate, more expensive, or slower. Unfortunately, none of that shows up as an obvious error, which can make it all the more damaging to production environments.
We wanted to see how that plays out in practice, so my team analyzed alerting data from more than 100 production AI agents across dozens of companies over seven months. We observed a consistent pattern:
-
Problems surface within days of monitoring starting.
-
Quality, cost, and speed problems show up first. Errors are the last thing to fire, and the least likely to fire at all.
-
Most problems come back. Runaway loops, in particular, tend to become chronic.
-
Problems arrive together: token spikes almost always come with other warning signs, most often a drop in output quality.
-
The checks teams have in place lean heavily toward output quality and cost, and barely touch governance and safety.
This article walks through each finding and what it means for how teams should monitor agents in production.
The data
The data comes from Monte Carlo, the company I co-founded, where these agents are monitored. It covers more than 100 production AI agents across dozens of customer companies, which run on Snowflake Cortex, Databricks Genie, or are custom builds that send OpenTelemetry-style traces to the company’s own warehouse. For this analysis, we looked at alerts on the agents raised between April 9 and November 2, 2026.
Each agent had some combination of checks on it, which we grouped into types:
-
Output quality evaluations, where an LLM judge scores answers for things like helpfulness, groundedness or task completion.
-
Token spend, latency and error checks on the agent’s runs, either as anomaly detection or fixed thresholds.
-
Runaway loop checks, which flag an agent repeating the same tool call, query or retry far more than a normal run needs.
-
Trajectory and validation checks on the sequence of steps the agent takes.
An “alert” means one of those checks fired. It is a threshold breach or anomaly, not a confirmed failure. We excluded internal, demo, test and trial workspaces, test monitors, development copies of production agents, and monitors that were paused and never fired. Agents with an identical setup in the same account were counted once. The limitations at the end matter for how far these numbers should be pushed.
Here are the key insights we found.
Problems surface within days
Across the data we looked at, we found that 89% of monitored agents raised at least one alert during the analysis period. Half did so within a week of their first check going live, and the median time to the first alert was just six days.
That says less about agent quality than about exposure to the real world. Agents often pass testing, but then they meet real users, real data and real edge cases on their first day in production. As a result, checks start firing almost immediately.
Quality and cost go wrong before errors surface
The more revealing question we interrogated is which checks actually fire, and when. For each type of check, we looked only at agents that had that check, then measured how many ever alerted and how long the first alert took.
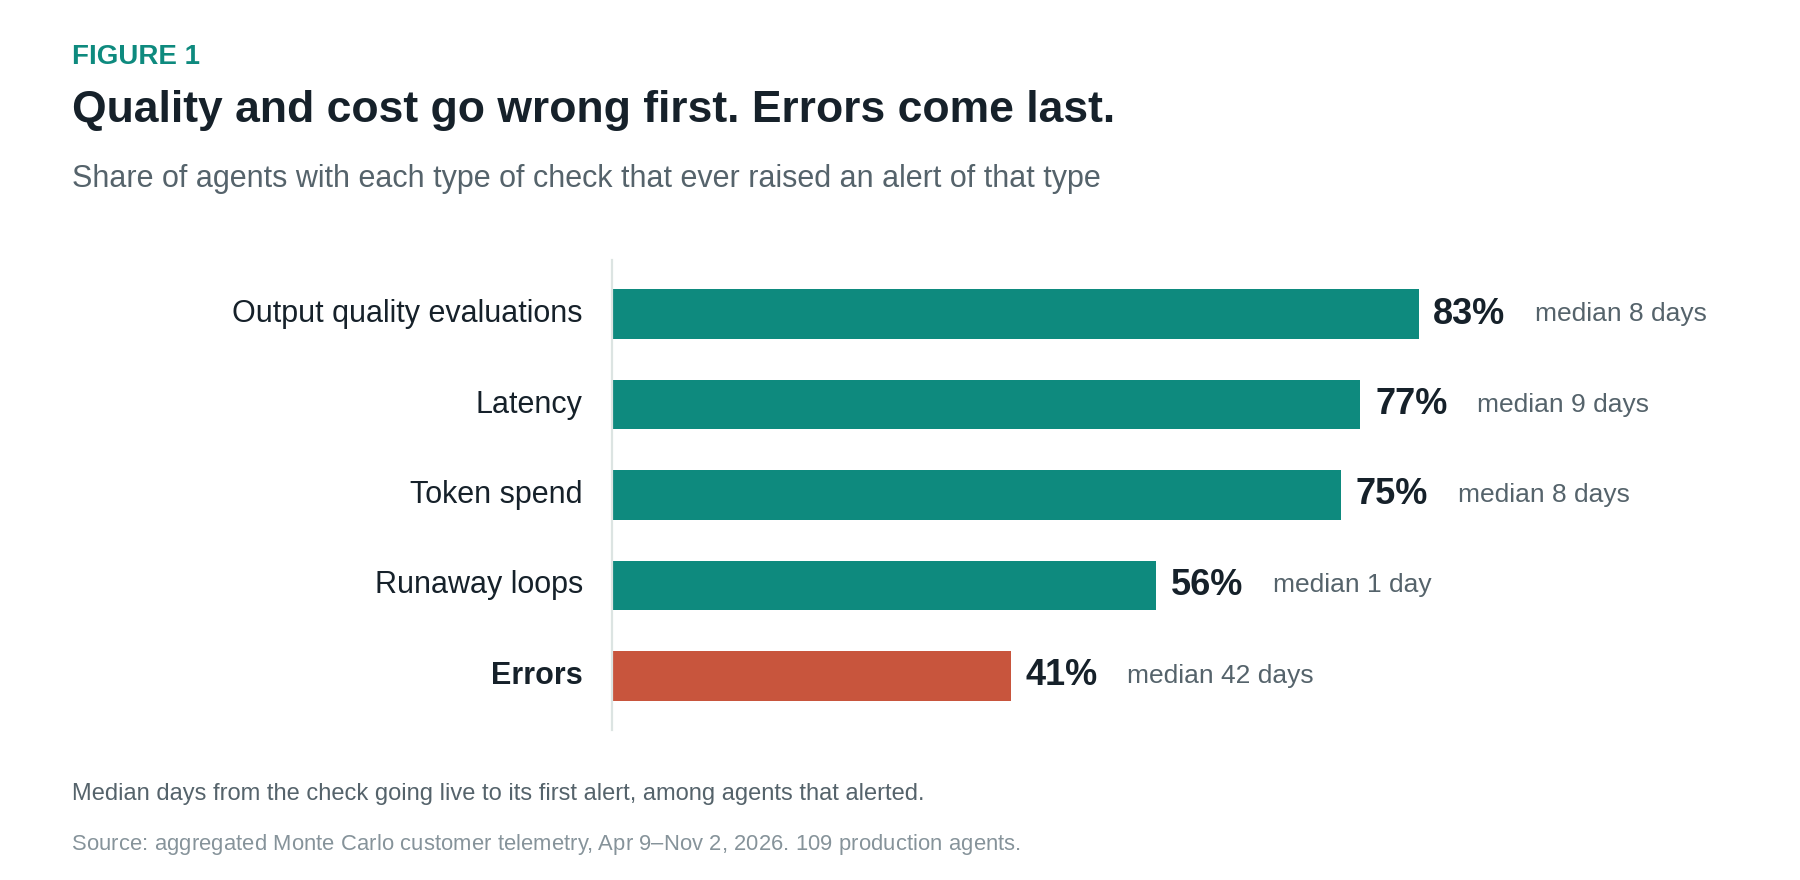
The monitors that watch how well and how efficiently an agent works fired early and often. 83% of agents with output quality evaluations raised a quality alert, with a median of eight days to the first one. Token spend and latency checks looked similar: about three-quarters of agents alerted, typically within eight or nine days. Loop checks, where they existed, fired almost immediately, with a median of one day.
As figure 1 shows, error checks were the outlier. Fewer than half the agents with error checks ever raised an error alert, and those that did took a median of 42 days – about six weeks.
When we looked at which alert arrived first for each agent, an error was among the first alerts for only about 1% of agents. Quality and token alerts were each among the first signals fired for 38%.
This is the core of the “drift” argument. By the time an agent produces something that an error check recognizes, it has usually already been giving worse answers, burning away more tokens, or running slower for weeks. A monitoring setup that starts with error rates is watching the last thing to change, and is missing the negative consequences that have been quietly piling up already.
Most problems keep coming back
The second pattern is persistence. For agents that alerted, we counted how many separate days each type of check fired.
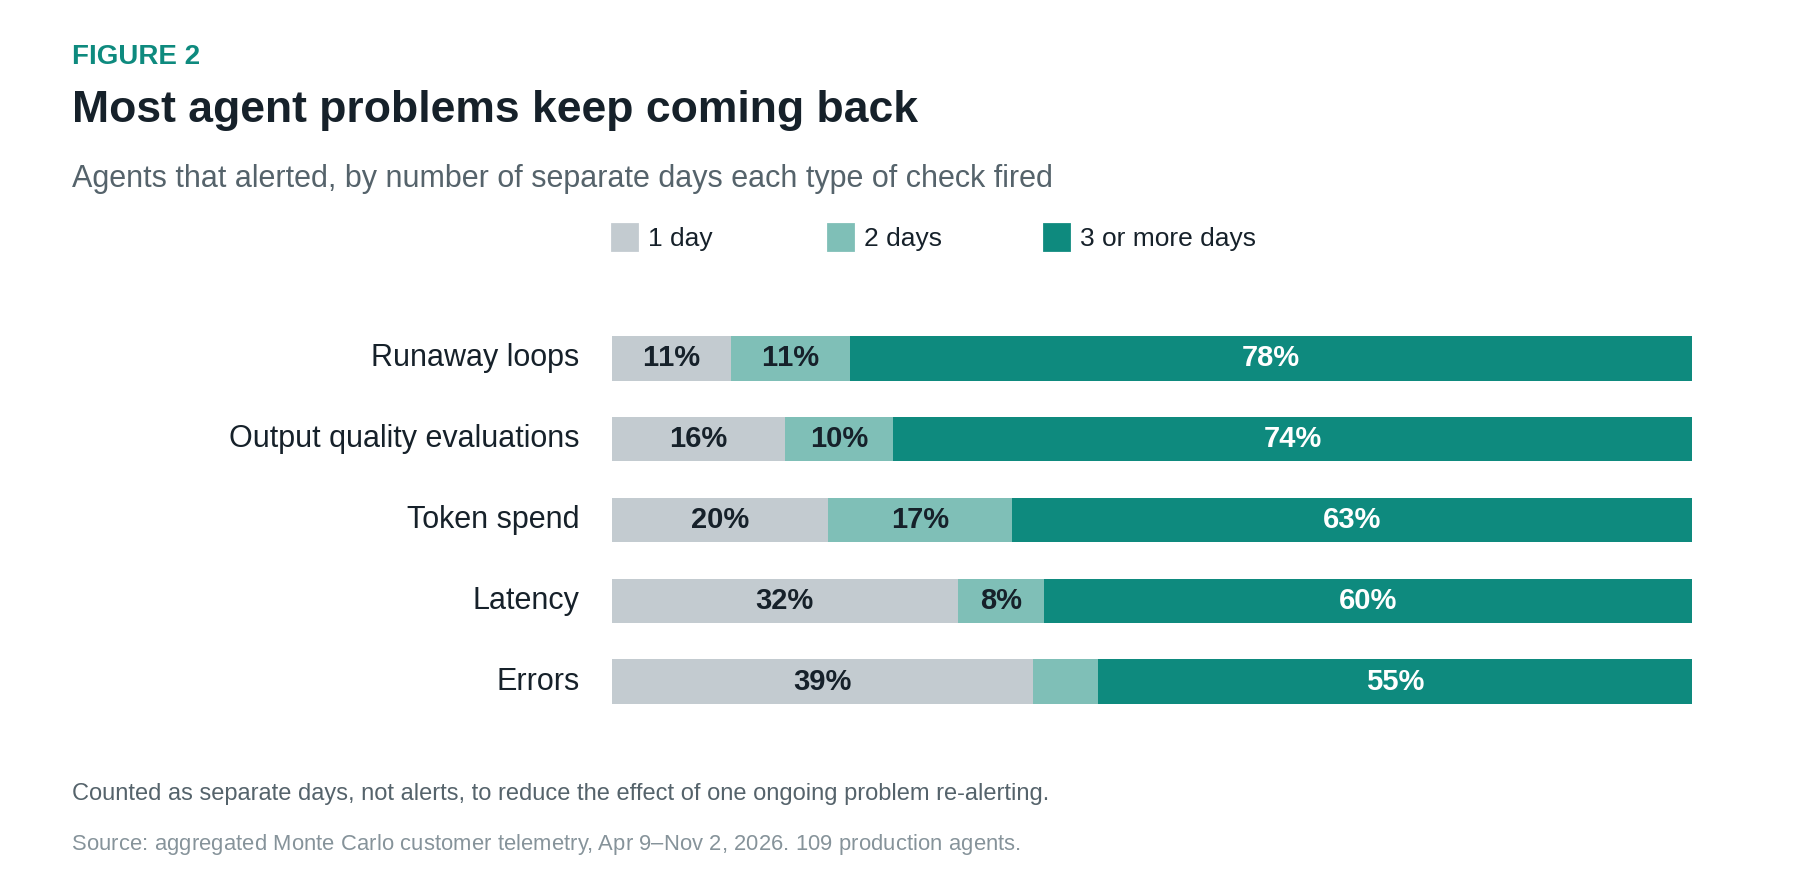
For every check type, most agents that alerted did so on three or more separate days. One-off alerts were the minority: 16% for quality evaluations, 20% for token spend and roughly a third for latency and errors. Runaway loops were the most persistent: 78% of agents with a loop alert had loop alerts on three or more days, with a median of nine separate days.
There is a caveat here, covered in the limitations: some checks can re-alert on the same ongoing condition. We counted separate days rather than alerts to reduce that effect, but some of what looks chronic will be one long-running problem. Either way, the practical point is the same: most agent problems are not fixed by a one-time patch, and treating each alert as an isolated incident hides that reality.
Cost, quality, and speed move together
If agents drift rather than break, it follows that the signals should move together. Token spend is a good place to test that theory, and it holds based on our analysis.
About three-quarters of agents with a token check raised at least one token anomaly, and almost all of those anomalies were increases: fewer than 3% were drops.
To see what else was happening when token use spiked, we took each day an agent had a token spike and looked for other alerts nearby: on the same agent within the two days up to and including the spike, or on another agent at the same company within a day. We then compared that with every other day for the same agents.
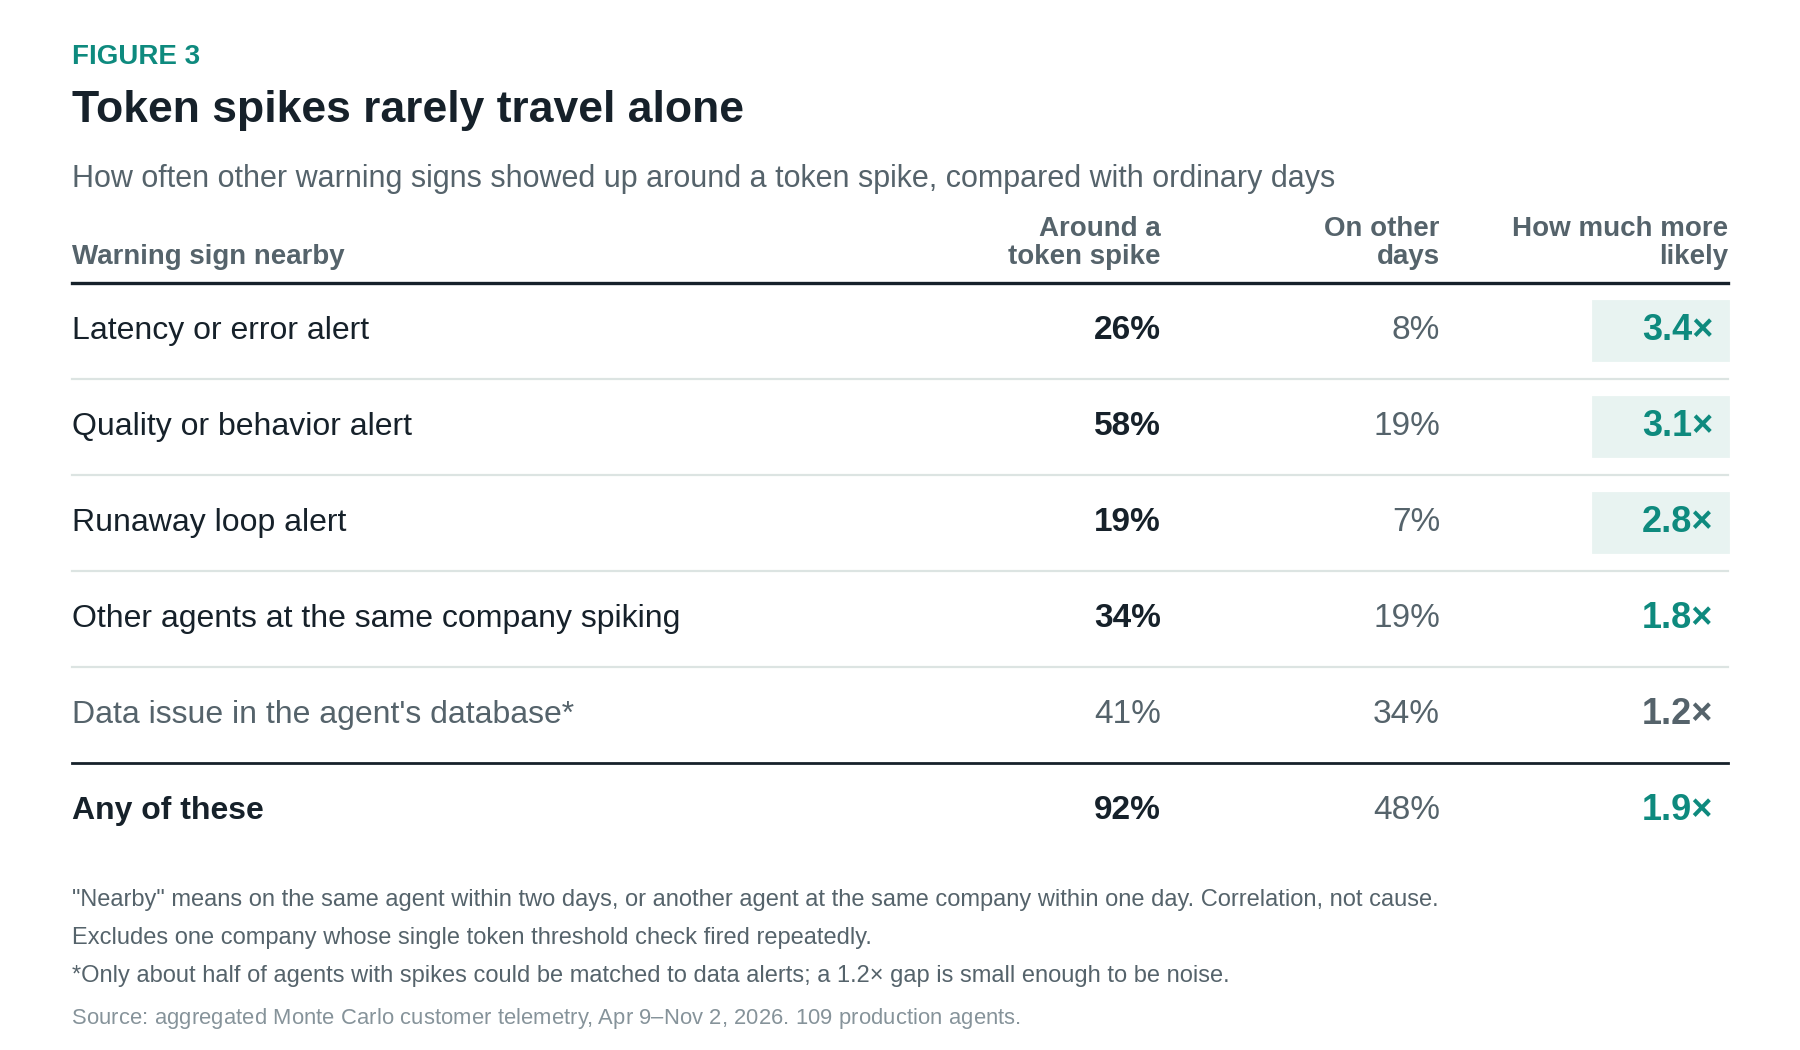
On 92% of spike days, at least one other warning sign showed up nearby, compared with 48% of ordinary days. The most common companion was a quality or behavior alert, like an evaluation score dropping or a tool being called out of order, which appeared around 58% of spikes versus 19% of other days. Latency and error alerts had the strongest link, at 3.4 times as likely around a spike as on other days, and loop alerts were 2.8 times as likely. In a third of cases, other agents at the same company spiked at the same time, which points to a shared cause such as a traffic surge or a model change.
None of this proves what caused any single spike. But it fits the drift pattern: when an agent starts behaving differently, cost, quality and speed tend to move at once, and a check that watches only one of them sees a fraction of the change.
Loops live in tool calls, where few teams look
Runaway loops deserve their own section, because they are both common and under-instrumented. About as many companies saw loop alerts as saw error-rate alerts. And 72% of loop alerts involved tool and SQL calls: an agent re-running the same query, retrying a failing tool or re-planning the same step.
Yet the timing checks most teams have in place don’t actually look there. Of agents with any latency or time-limit check, 84% time the end-to-end run and only 18% time individual tool calls. Four in five agents monitored for loops have no timing check on their tool calls at all. When a loop slows a run down, the team can see that the run took longer, but not which individual tool got stuck.
Token spend has the same blind spot. Of the token checks in the sample, 62% watch a whole run, trace or conversation, and another 24% watch daily or hourly totals. Only 8% are tied to a specific tool, step or span. That leaves nearly nine in ten agents with a token check able to show that spend went up, but not which step burned the tokens.
The governance gap in what teams are watching
Looking across all the agents in the sample, Figure 4 illustrates the share with at least one check of each type.
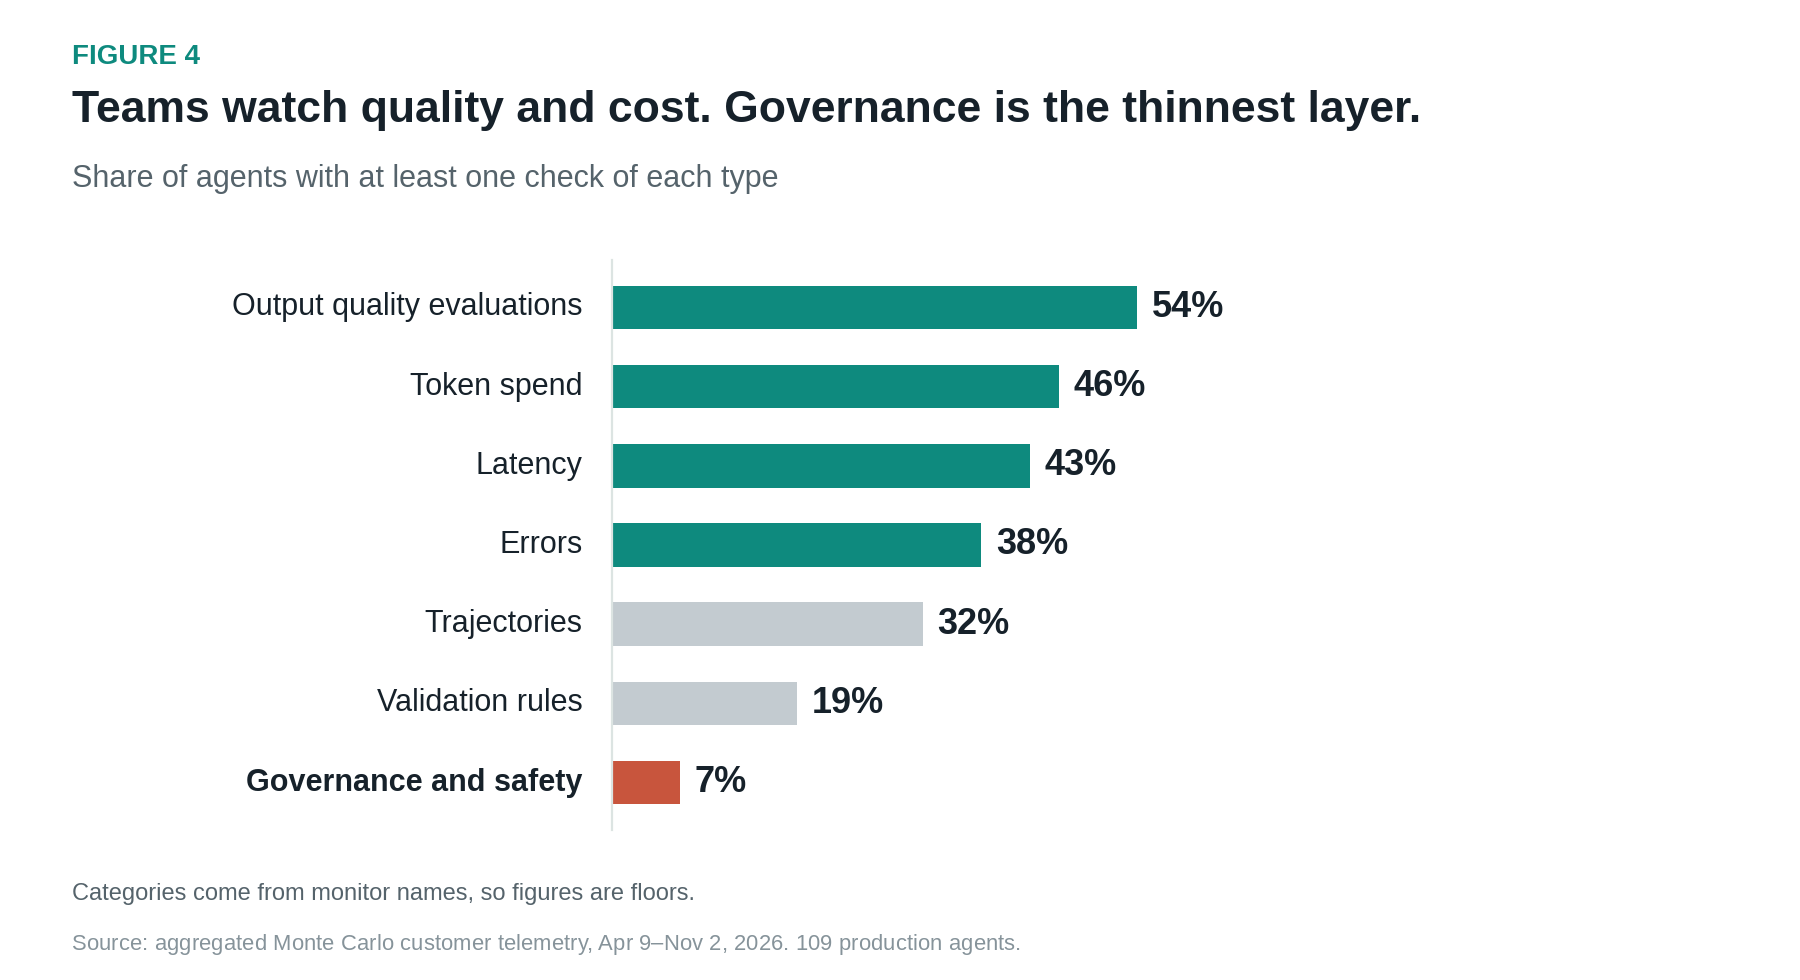
Output quality evaluations are the most common, followed by token spend, latency and errors. Trajectory checks and validation rules are less common, and governance and safety checks (prompt injection, PII leakage, out-of-scope requests, policy violations) are the thinnest layer, at fewer than one in ten agents.
Two caveats apply: these categories come from monitor names, so a governance check with a generic name will be missed and the figures are floors. And a large share of these checks were set up with help from the monitoring vendor, so coverage partly reflects product defaults rather than only what teams chose. Even allowing for both, the gap between quality monitoring and governance monitoring is large.
Teams are using AI to monitor AI
One more pattern stood out. Among the monitors that customers built themselves, 57% were written by describing what they wanted to an AI in a chat interface rather than configured by hand. Teams are already using AI to decide what to watch in their AI. That makes it easy to add checks quickly, and it also makes it worth reviewing what those checks actually measure, given how much of the risk sits in steps and categories that are easy to overlook.
When teams ask an LLM to generate checks, the LLM naturally defaults to asking for output quality, accuracy, and tone. It rarely suggests looking for tool-call latency loops, data-freshness traps, or prompt injection without explicit prompting. AI makes it easy to spin up monitoring, but it tends to replicate our own blind spots.
What this means if you run agents
Insights like these have a few implications for teams running and monitoring production agents.
Don’t rely on error rates,asthey are the last signal to move. Put output quality evaluations, token spend, and latency monitors in place first, because those are what show early markers when an agent starts to drift.
Don’t treat each alert as a separate ticket. Agent problems tend to occur – and recur – together. Seeing all of an agent’s alerts together over a few weeks, including cost, quality, speed, and loops, shows patterns that a feed of one-off alerts hides.
Watch the tool calls. Loops are common, persistent, and are concentrated in tool and SQL calls. Time individual tool calls, count repeated calls within a run, and tag token counts with the step they belong to, rather than relying only on run-level totals to give you a sense of performance.
Work on closing the governance gap. Safety and policy checks don’t typically appear by default. Decide which risks matter for each agent (PII, injection, scope) and add checks for them explicitly, otherwise you may have agents accessing and sharing things they shouldn’t.
Check whether the aforementioned patterns hold for you. Look back at a few months of your own alerts and ask two questions: which type of check tends to fire first on a new agent, and how often the same agent trips the same check again. If error checks fire first and quality checks rarely fire at all, either your agents are unusually stable or your quality checks are too loose to catch drift.
Limitations
-
Correlation and exposure, not cause. These are alerting patterns, not audits of agent behavior. An alert is a threshold breach, not a confirmed failure.
-
Uneven coverage. Agents usually have several quality evaluations and only one error check, so quality checks have more chances to fire. That inflates the quality numbers somewhat, though it does not explain why most error checks never fired.
-
Who set up the checks. The data comes from customers of one monitoring platform, and the platform or its staff set up more than half of the monitors, automatically or during onboarding. Default thresholds, especially for error checks, may be set conservatively, which would make errors look quieter than they are.
-
Re-alerting. Some checks can raise a new alert each day for one ongoing condition. Counting separate days reduces, but does not remove, that effect on the recurrence figures.
-
Concentration and small groups. Latency and loop alerts lean on a small number of companies, and trajectory and validation checks covered too few agents to report on separately.
Conclusion
The clearest thing this data says about production agents is that they rarely fail the way traditional software does. Failure emerges as drift — deteriorating answer quality, increased latency, and slowly rising costs — rather than a screaming error. When alerts do come in, they might arrive days or weeks after the original issue developed, resulting in problems that fester and permeate through a system. They also tend to recur, so treating each alert as a one-off incident can hide what’s really going on.
To be explicit about this data and its limitations, there are things that it can and can’t show. For instance, it came from teams that had already chosen to monitor their agents with a commercial platform, likely skewing our sample in favor of organizations with large, complex deployments. Additionally, we are only able to see problems that the monitors were configured to catch. We can’t know how much agent drift is happening that has not yet been noticed, nor can we distinguish between legitimate problems and thresholds that are perhaps too sensitive. That is a nuance of each unique case that is for an engineer familiar with the deployment to say. Also, many teams already catch more obvious errors using existing application monitoring tools, potentially influencing the quieter error readings in this data.
Even with those caveats, the patterns of silent drift are still important to act on, and doing so does not require a dedicated product.
Teams can get much of the way there with OpenTelemetry tracing, open-source evaluation frameworks, and queries against traces in their own warehouse. What’s more, some of the most effective measures aren’t monitoring at all. These include things like putting hard caps on tool retries and steps per run, implementing per-run token budgets, building regression test sets based on real production traffic, and ensuring human review of sampled outputs. More checks aren’t automatically better, either; every alert demands an engineer’s attention, and alert fatigue is a very real consequence of a noisy setup.
Prevention at design time, using tactics like the aforementioned ones, works well in combination with monitoring and detection in production. Whatever tooling you use, consider the quieterstems and products will be much better for it
Disclosure: I’m the co-founder and CEO of Monte Carlo. The data in this article is aggregated, anonymized telemetry from Monte Carlo customers.
