

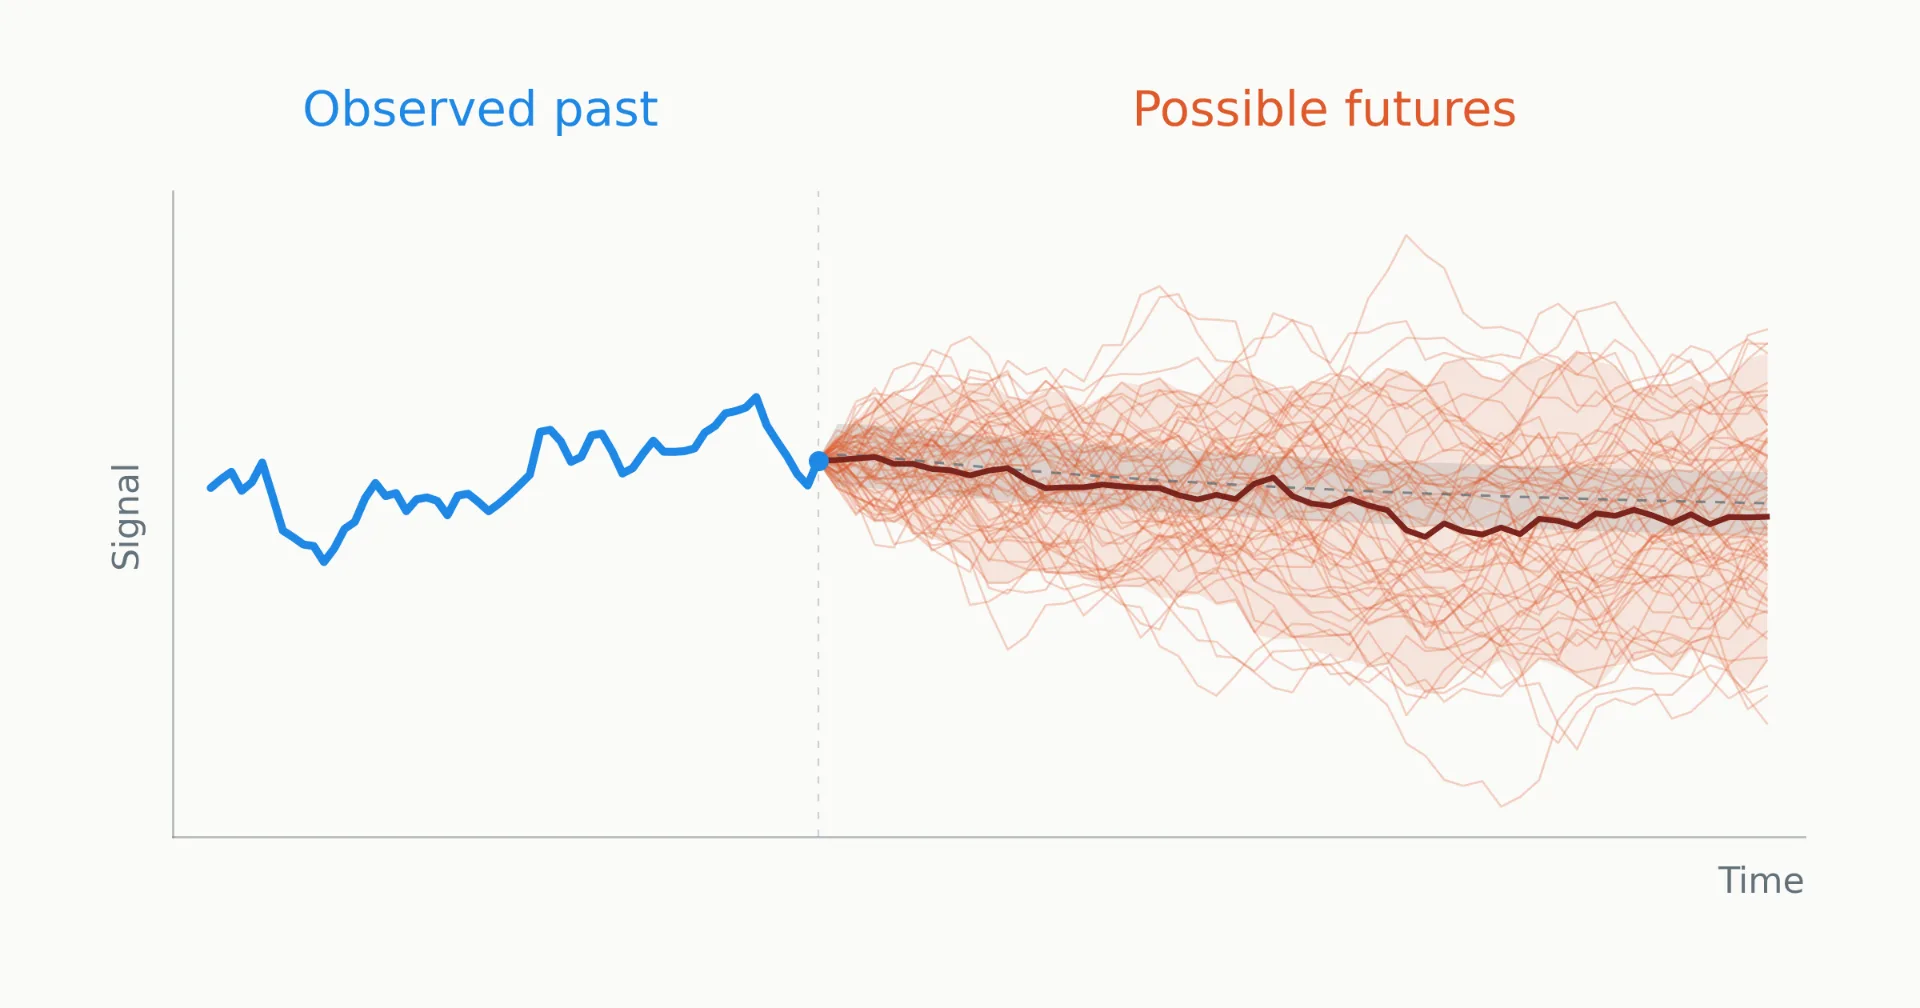
In a previous article, we saw why training with MSE forces a model to report only the conditional mean, and howGaussian NLL lets it learn an honest per-step uncertainty σ
sigma as well. That was the one-step story. This post picks up where that left off.
Everything we built in Part I — the Gaussian NLL, the two-term loss, the proof that the model learns both the conditional mean and the conditional variance — was about one-step-ahead prediction: given a context window of T
T observed values, predict the distribution of the very next value x
T
+
1
x_{T+1}.
At inference time, in any real application, this is rarely enough. You want to know what happens over the next 10, 100, or 1000 steps. You want a forecast, not a single prediction. And if your model is probabilistic, you want that forecast to carry honest uncertainty all the way to the end of the horizon.
This post is about how to do this correctly. One could think immediately of the naive approach, that is applying the model repeatedly, feeding its predictions back as inputs is secretly a deterministic operation that discards the uncertainty the model spent so much effort learning. Fixing this requires thinking carefully about what a joint distribution over future values actually is, and how to approximate it with Monte Carlo sampling. The fix is barely more code than the naive version, but it gives a fundamentally different and fundamentally better forecast.
Everything here is built and checked in thecompanion notebook: the two rollout approaches, applied to the same trained model, on the same signal, with coverage and PIT diagnostics (all explained in this post).
Recapping the one-step setting
In Part I, we trained a model that takes a context window of T
T observed values and outputs two numbers:
(
μ
T
+
1
,
σ
T
+
1
)
=
f
θ
(
x
1
,
x
2
,
…
,
x
T
)
(mu_{T+1},; sigma_{T+1}) = f_theta(x_1, x_2, ldots, x_T)
These parameterise a Gaussian distribution over the next time step T
+
1
T+1:
x
T
+
1
∣
x
1
:
T
∼
N
(
μ
T
+
1
,
σ
T
+
1
2
)
x_{T+1} mid mathbf{x}_{1:T} ;sim; mathcal{N}(mu_{T+1},; sigma_{T+1}^2)
This is a conditional distribution, it tells us everything about x
T
+
1
x_{T+1} given that we know x
1
x_1 through x
T
x_T exactly. The uncertainty σ
T
+
1
sigma_{T+1} captures the irreducible randomness at that one step: the noise we cannot predict no matter how good the model is. The Gaussian NLL loss trained the model to get both μ
mu and σ
sigma right, that is the conditional mean and the conditional variance at each individual step.
Clean, well-defined, and exactly what the loss was designed to learn. The problem starts the moment someone asks: okay, but what happens over the next 50 steps?
The multi-step inference problem
In any real application, you don’t just need the next value. You need a forecast, a prediction over an extended horizon. “Will this signal cross the alarm threshold sometime in the next hour?” “What does the load profile look like for the rest of the day?” These questions require predicting not one step but many.
Suppose we want to forecast the next H
H steps: x
T
+
1
,
x
T
+
2
,
…
,
x
T
+
H
x_{T+1}, x_{T+2}, ldots, x_{T+H}. The quantity we want is the joint predictive distribution:
p
(
x
T
+
1
,
x
T
+
2
,
…
,
x
T
+
H
∣
x
1
:
T
)
p(x_{T+1},, x_{T+2},, ldots,, x_{T+H} mid mathbf{x}_{1:T})
Notice what this is. It’s not H
H separate distributions. It’s one distribution over H
H-dimensional space, a distribution over entire sequences. The value at step T
+
3
T+3 depends on what happened at steps T
+
1
T+1 and T
+
2
T+2. The future values are correlated with each other because each one feeds into the next.
There’s a standard tool from probability theory, which is the chain rule that factors any joint distribution into a product of conditionals:
p
(
x
T
+
1
:
T
+
H
∣
x
1
:
T
)
=
∏
h
=
1
H
p
(
x
T
+
h
∣
x
1
:
T
+
h
−
1
)
p(x_{T+1:T+H} mid mathbf{x}_{1:T}) = prod_{h=1}^{H} p(x_{T+h} mid mathbf{x}_{1:T+h-1})
Each factor is a one-step conditional distribution: “what’s the distribution of the next value given everything before it?”, which is exactly what the model was trained to produce.
So in principle, you can build the joint distribution one step at a time: predict step T
+
1
T+1 given the observed history, then predict step T
+
2
T+2 given the observed history plus step T
+
1
T+1, then step T
+
3
T+3 given all of the above, and so on.
But here’s the catch. For step T
+
2
T+2, the conditioning includes x
T
+
1
x_{T+1}, a value you don’t actually have. You only observed up to x
T
x_T. Everything beyond that is the model’s own prediction. And that prediction is uncertain, it’s a distribution, not a number.
How you handle this unknown is the entire story of this post. There are two strategies that look similar in code but are conceptually and statistically very different.
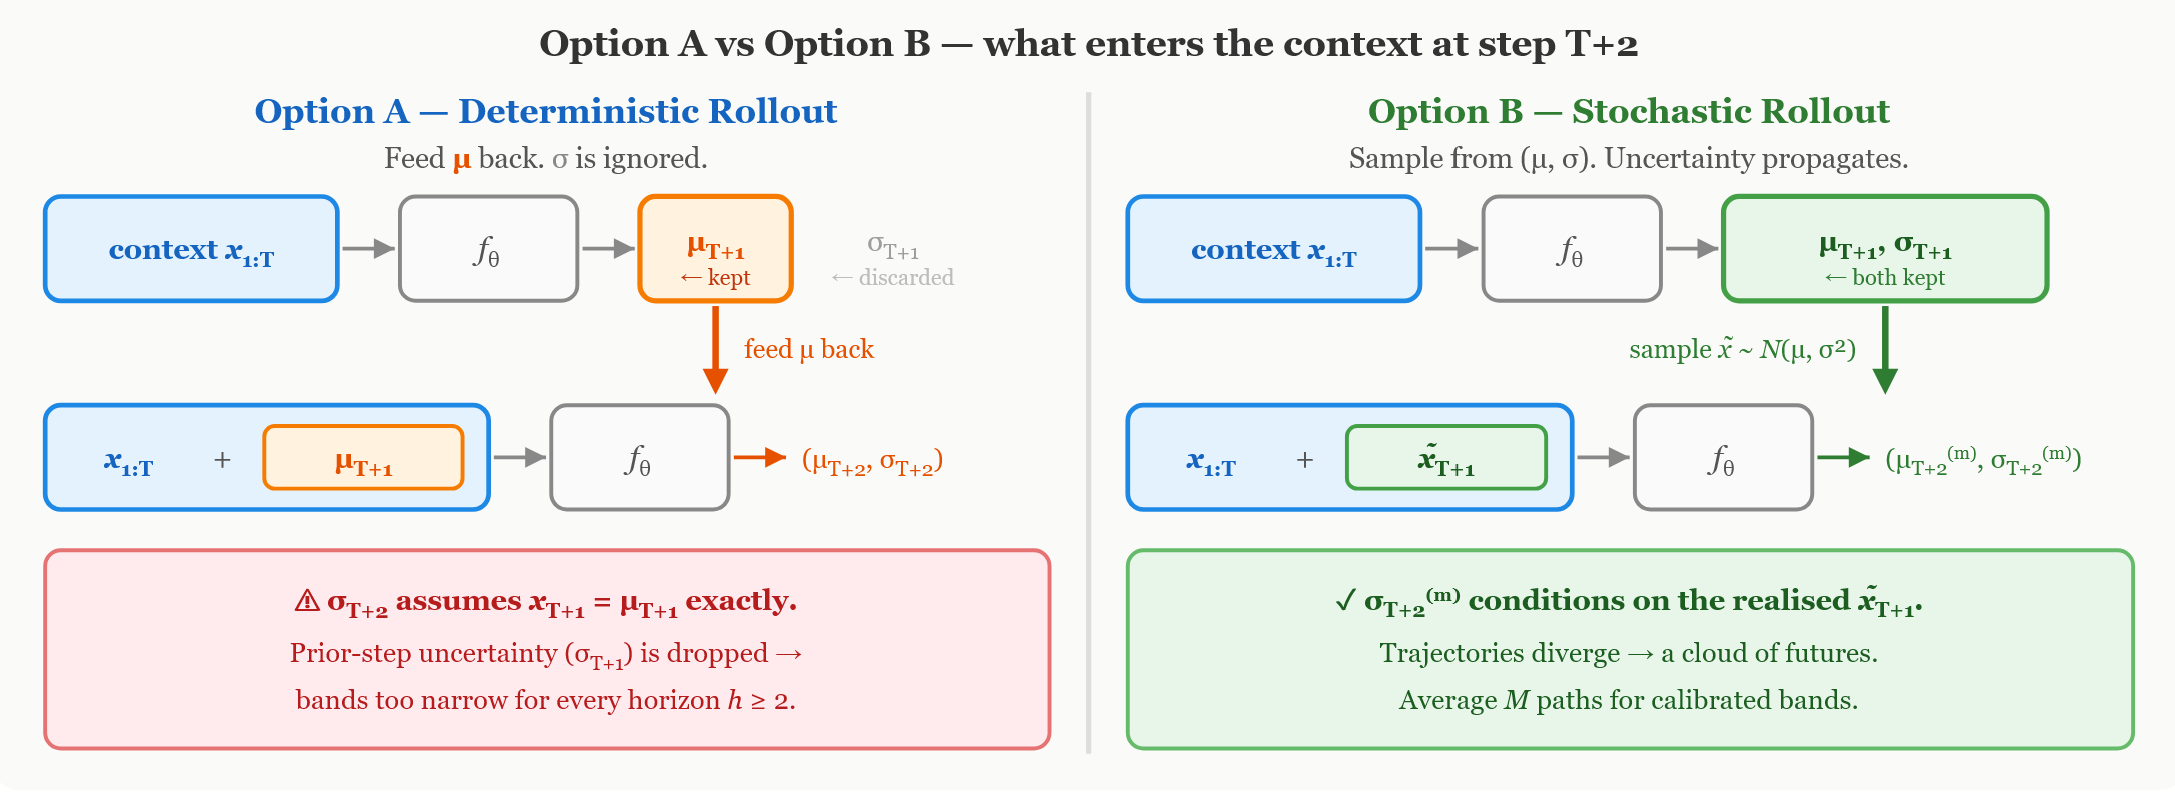
Two approaches for probabilistic autoregressive forecasting.
Strategy A: The deterministic rollout: feed μ
mu back
The simplest thing you could do: at each step, predict (
μ
,
σ
)
(mu, sigma), take only theμ
mu, plug it into the context as if it were an observed value, and move on. The recursion looks like this:
x
^
1
:
T
+
1
=
[
x
1
:
T
,
μ
T
+
1
]
(append
μ
, discard
σ
)
hat{mathbf{x}}_{1:T+1} = [mathbf{x}_{1:T},; mu_{T+1}] qquad text{(append } mutext{, discard } sigmatext{)}
(
μ
T
+
2
,
σ
T
+
2
)
=
f
θ
(
x
^
1
:
T
+
1
)
(mu_{T+2},, sigma_{T+2}) = f_theta(hat{mathbf{x}}_{1:T+1})
x
^
1
:
T
+
2
=
[
x
^
1
:
T
+
1
,
μ
T
+
2
]
hat{mathbf{x}}_{1:T+2} = [hat{mathbf{x}}_{1:T+1},; mu_{T+2}]
You get a sequence of means μ
T
+
1
,
μ
T
+
2
,
…
,
μ
T
+
H
mu_{T+1}, mu_{T+2}, ldots, mu_{T+H} and a parallel sequence of sigmas σ
T
+
1
,
…
,
σ
T
+
H
sigma_{T+1}, ldots, sigma_{T+H}. Looks like a complete probabilistic forecast. In code, it’s very straightforward:
def deterministic_rollout(model, context, horizon):mus, sigmas = [], []for h in range(horizon):mu, log_sigma = model(context)sigma = torch.exp(log_sigma)mus.append(mu.item())sigmas.append(sigma.item())# slide the window: drop the oldest value, append muctx = torch.cat([ctx[1:], mu.reshape(1)])return np.array(mus), np.array(sigmas)Simple and clean, but, unfortunately wrong in a way that actually matters.
Think about what the model is being asked at step T
+
2
T+2. It receives a context that ends with μ
T
+
1
mu_{T+1}, a specific, exact number. The model treats it as if that value actually happened. So when it produces σ
T
+
2
sigma_{T+2}, it’s answering the question:“Given that the previous value wasexactlyμ
T
+
1
mu_{T+1}, how uncertain am I about the next step?”
But, this is the wrong question. The previous value was notexactlyμ
T
+
1
mu_{T+1}. It was drawn from a distributionN
(
μ
T
+
1
,
σ
T
+
1
2
)
mathcal{N}(mu_{T+1}, sigma_{T+1}^2). It could have been higher or lower. The correct question is: “Given that the previous value wassomewhere aroundμ
T
+
1
mu_{T+1}with spreadσ
T
+
1
sigma_{T+1}, how uncertain am I about the next step?”
The second question always has a strictly larger answer. Always. Because it has to account for twotainty inherited from the previous step
Imagine you’re navigating by compass, and each reading has a small error. One step off course is fine, that’s σ
T
+
1
sigma_{T+1}. But if you take 50 steps, each slightly off, the errors accumulate. You could be very far from where you think you are.
Now here’s the key: if you recalculateyour position at each step assuming you’re exactly where you planned to be, not where you actually are, your navigation uncertainty stays small on paper even though you’re actually drifting. After 50 steps, your map says “uncertainty: 2 meters.” Reality says you might be 200 meters off. The map isn’t lying about any single step’s compass error. It’s lying by pretending that every previous step landed perfectly, which none of them did.
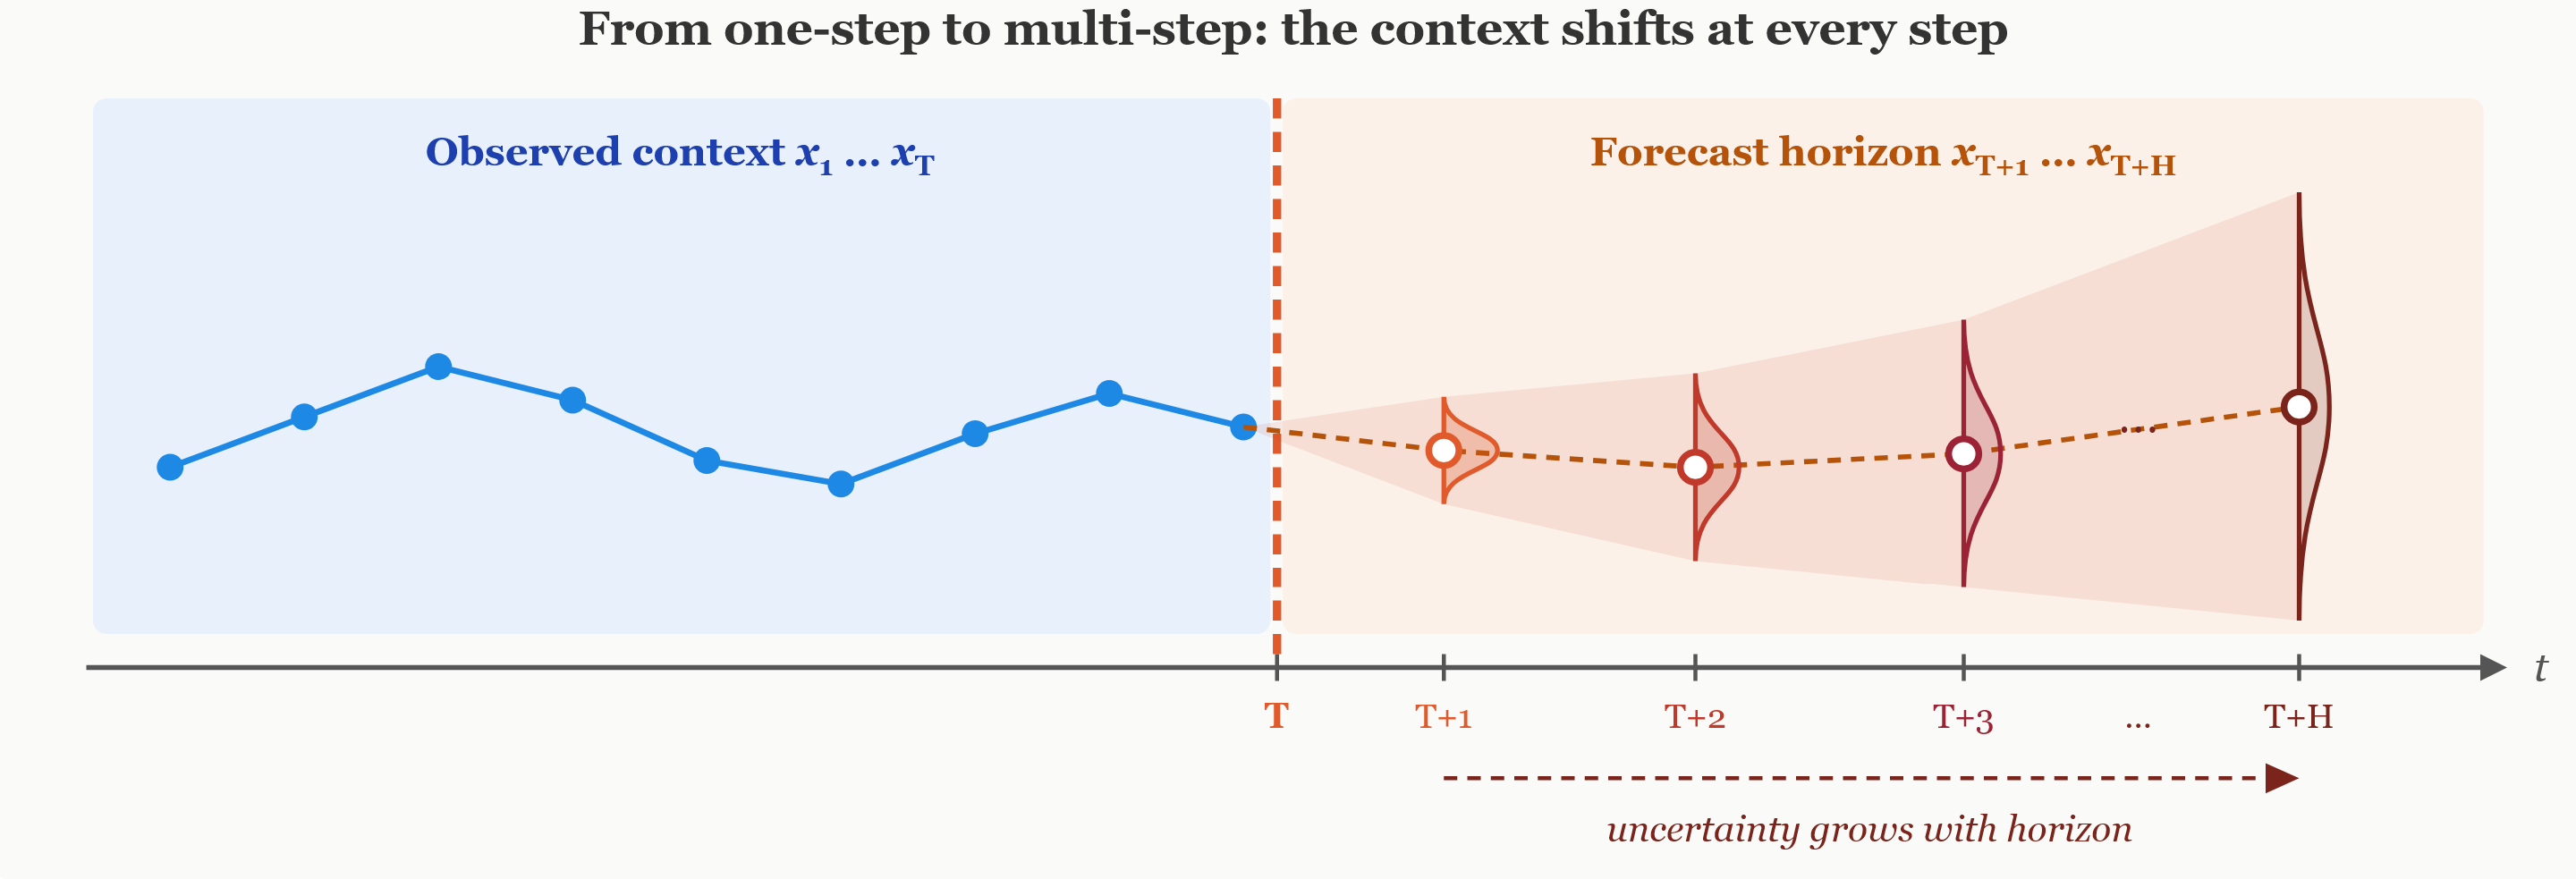
Probabilistic multi-step inference problem.
That’s exactly what deterministic rollout does. Each σ
T
+
h
sigma_{T+h}is an honest answer to a dishonest question. The model is asked “how uncertain are you about the next step, given that the last step was exactly μ
mu?” and it answers correctly. But the premise is false. The last step wasn’t exactly μ
mu. It was drawn from a spread. And by the time you’re 50 steps out, you’ve told 49 lies about perfect inputs, and the accumulated dishonesty shows up as a confidence band that’s far too narrow.
Strategy B: The stochastic rollout: sample and feed back
The fix is simple: instead of feeding μ
mu back, draw a random sample from the predicted distribution and feed that back. Run this M
M times to get M
M plausible futures.
Step by step, for one trajectory (labeled m
m):
x
T
+
1
(
m
)
∼
N
(
μ
T
+
1
,
σ
T
+
1
2
)
x_{T+1}^{(m)} sim mathcal{N}(mu_{T+1},; sigma_{T+1}^2)
(
μ
T
+
2
(
m
)
,
σ
T
+
2
(
m
)
)
=
f
θ
(
x
1
:
T
,
x
T
+
1
(
m
)
)
(mu_{T+2}^{(m)},, sigma_{T+2}^{(m)}) = f_theta(mathbf{x}_{1:T},, x_{T+1}^{(m)})
x
T
+
2
(
m
)
∼
N
(
μ
T
+
2
(
m
)
,
σ
T
+
2
(
m
)
2
)
x_{T+2}^{(m)} sim mathcal{N}(mu_{T+2}^{(m)},; sigma_{T+2}^{(m),2})
The superscript (
m
)
(m) marksone trajectory, one possible future. Because step 1 was a random draw, the value x
T
+
1
(
m
)
x_{T+1}^{(m)} differs from μ
T
+
1
mu_{T+1}. This means the model sees a different context at step 2, producing different (
μ
T
+
2
(
m
)
,
σ
T
+
2
(
m
)
)
(mu_{T+2}^{(m)}, sigma_{T+2}^{(m)}), leading to a different samplex
T
+
2
(
m
)
x_{T+2}^{(m)}, and so on. Every downstream step is affected by the randomness at every upstream step. Uncertainty propagates through the chain, compounding naturally.
But one trajectory is just one possible future, a single random path through the space of sequences. To approximate the full joint distribution, you runM
M independent trajectories, each from the same observed history x
1
:
T
mathbf{x}_{1:T}, each diverging because of fresh random draws.
In code, the key trick is to process all M
M trajectories as a single batch, one forward pass per horizon step, not M
M separate passes:
def stochastic_rollout(model, context, horizon, M=500):# copy the context M times: (M, T)ctx = context.unsqueeze(0).expand(M, -1).clone()trajectories = torch.zeros(M, horizon)for h in range(horizon):mu, log_sigma = model(ctx) # (M,) eachsigma = torch.exp(log_sigma)# each trajectory draws its own random samplesample = mu + sigma * torch.randn(M)trajectories[:, h] = sample# slide each window: drop oldest, append this trajectory's samplectx = torch.cat([ctx[:, 1:], sample.unsqueeze(1)], dim=1)return trajectoriesTake a minute to compare the two functions. The structure is identical, a loop over horizon steps, with a sliding context window. The only difference is one line: deterministic rollout appends mu, stochastic rollout appends sample. That one-line change is the difference between throwing away uncertainty and propagating it correctly.
Why uncertainty must grow: the law of total variance
The intuition above, propagated uncertainty makes things wider can be made precise with a single theorem: the law of total variance:
Var
(
X
)
=
E
[
Var
(
X
∣
Y
)
]
⏟
average local noise
+
Var
(
E
[
X
∣
Y
]
)
⏟
uncertainty about the input
text{Var}(X) = underbrace{mathbb{E}[text{Var}(X mid Y)]}_{text{average local noise}} + underbrace{text{Var}(mathbb{E}[X mid Y])}_{text{uncertainty about the input}}
In plain language: the total uncertainty aboutX
Xis the sum of two parts. First, theaverage noise you’d see even if you knew Y
Y exactly. Second, the extra spread caused by the fact that different values of Y
Y lead to different predictions for X
X. Since variances can’t be negative, the total is always at least as large as either part alone.
Apply this to forecasting. Let X
=
x
T
+
2
X = x_{T+2} and Y
=
x
T
+
1
Y = x_{T+1}:
Var
(
x
T
+
2
∣
x
1
:
T
)
=
E
[
Var
(
x
T
+
2
∣
x
1
:
T
,
x
T
+
1
)
]
⏟
Term I: aleatoric
+
Var
(
E
[
x
T
+
2
∣
x
1
:
T
,
x
T
+
1
]
)
⏟
Term II: propagated
text{Var}(x_{T+2} mid mathbf{x}_{1:T}) = underbrace{mathbb{E}[text{Var}(x_{T+2} mid mathbf{x}_{1:T}, x_{T+1})]}_{text{Term I: aleatoric}} + underbrace{text{Var}(mathbb{E}[x_{T+2} mid mathbf{x}_{1:T}, x_{T+1}])}_{text{Term II: propagated}}
Term I is the expected one-step noise at step T
+
2
T+2, averaged over possible values of x
T
+
1
x_{T+1}. Even if we knew x
T
+
1
x_{T+1} exactly, the model would still be uncertain about x
T
+
2
x_{T+2}. This is what deterministic rollout captures.
Term II is the variance of the conditional mean μ
2
(
x
T
+
1
)
mu_2(x_{T+1}) caused by the randomness in x
T
+
1
x_{T+1}. Since x
T
+
1
x_{T+1} is uncertain and the prediction for x
T
+
2
x_{T+2} depends on it, the center of the step-2 prediction is itself a random variable. This term is zero in deterministic rollout, because feeding μ
1
mu_1 back treats x
T
+
1
x_{T+1} as fixed, making μ
2
mu_2 a constant rather than a random variable. Let’s spell it out to see exactly where the gap is. Assume the model is a perfect one-step predictor and define:
-
μ
1
=
E
[
x
T
+
1
∣
x
1
:
T
]
mu_1 = mathbb{E}[x_{T+1} mid mathbf{x}_{1:T}], σ
1
2
=
Var
(
x
T
+
1
∣
x
1
:
T
)
sigma_1^2 = text{Var}(x_{T+1} mid mathbf{x}_{1:T}) -
μ
2
(
x
T
+
1
)
=
E
[
x
T
+
2
∣
x
1
:
T
+
1
]
mu_2(x_{T+1}) = mathbb{E}[x_{T+2} mid mathbf{x}_{1:T+1}], which depends on what x
T
+
1
x_{T+1} was -
σ
2
2
(
x
T
+
1
)
=
Var
(
x
T
+
2
∣
x
1
:
T
+
1
)
sigma_2^2(x_{T+1}) = text{Var}(x_{T+2} mid mathbf{x}_{1:T+1}), also a function of x
T
+
1
x_{T+1}
Note the key thing: μ
2
mu_2 and σ
2
2
sigma_2^2 are written as functions of x
T
+
1
x_{T+1} because the prediction at step 2 changes depending on what happened at step 1. If x
T
+
1
x_{T+1} is high, μ
2
mu_2 shifts one way. If x
T
+
1
x_{T+1} is low, it shifts another.
Deterministic rollout evaluates σ
2
2
sigma_2^2 at one specific input: x
T
+
1
=
μ
1
x_{T+1} = mu_1. It gets:
Var
det
(
x
T
+
2
)
=
σ
2
2
(
μ
1
)
text{Var}_{text{det}}(x_{T+2}) = sigma_2^2(mu_1)
While stochastic rollout, through its many trajectories, captures both terms of the law of total variance:
Var
sto
(
x
T
+
2
)
=
E
[
σ
2
2
(
x
T
+
1
)
]
+
Var
(
μ
2
(
x
T
+
1
)
)
text{Var}_{text{sto}}(x_{T+2}) = mathbb{E}[sigma_2^2(x_{T+1})] + text{Var}(mu_2(x_{T+1}))
Var
stochastic
=
E
[
σ
2
2
]
⏟
average noise
+
Var
(
μ
2
)
⏟
propagated
≥
σ
2
2
(
μ
1
)
⏟
deterministic
boxed{text{Var}_{text{stochastic}} = underbrace{mathbb{E}[sigma_2^2]}_{text{average noise}} + underbrace{text{Var}(mu_2)}_{text{propagated}} ;geq; underbrace{sigma_2^2(mu_1)}_{text{deterministic}}}
The inequality holds because Var
(
μ
2
)
≥
0
text{Var}(mu_2) geq 0. And it’s strictly positive whenever μ
2
mu_2 actually varies with x
T
+
1
x_{T+1}, which is true for any signal with structure. The gap is the propagated uncertainty that deterministic rollout misses entirely.
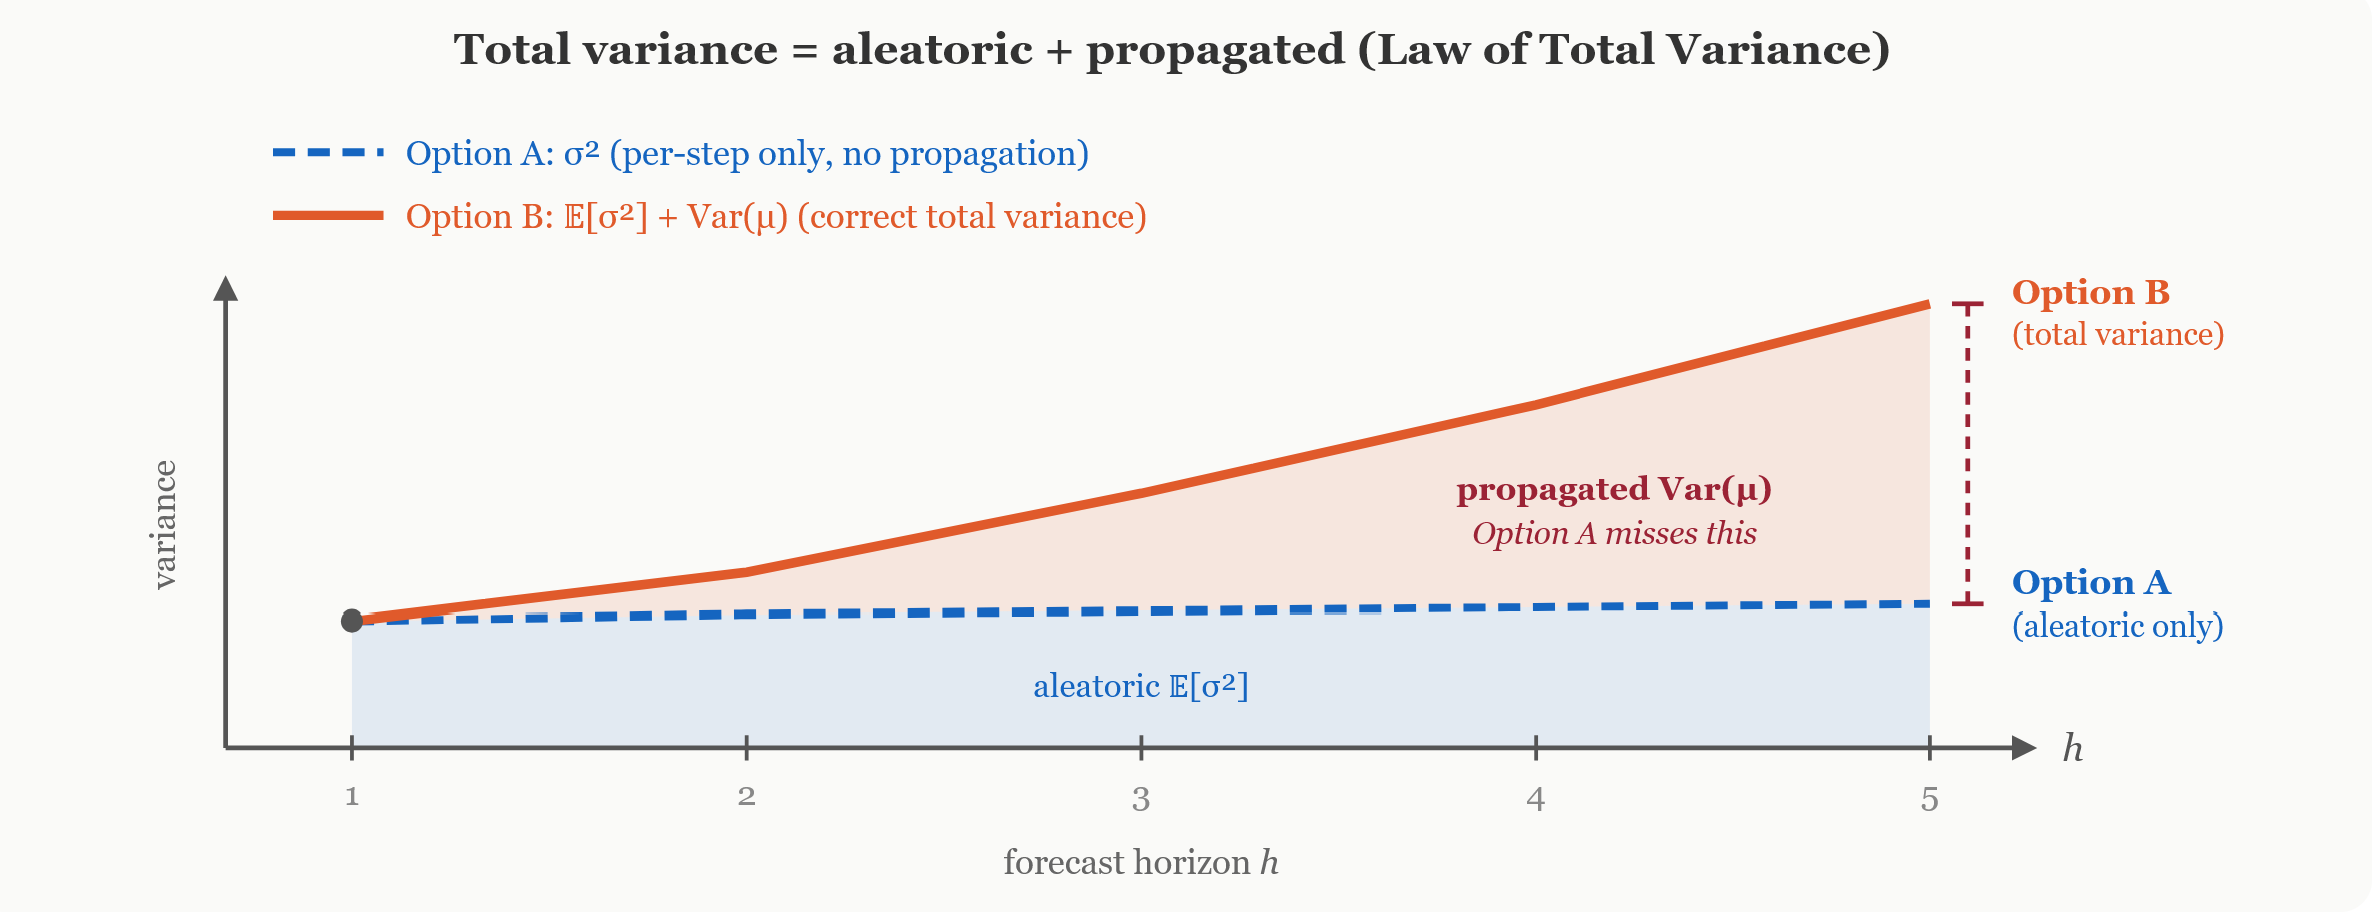
Law of total variance in probabilistic autoregressive forecasting
At step T
+
3
T+3, the same decomposition applies again. The model needs x
T
+
2
x_{T+2} as input, but x
T
+
2
x_{T+2} is itself uncertain and its uncertainty already includes one layer of propagation from step T
+
1
T+1. So step T
+
3
T+3 inherits an even larger input uncertainty, which generates an even larger propagation term, which feeds into step T
+
4
T+4, and so on.
Each step adds its own layer on top of everything accumulated before. Deterministic rollout misses every one and the gap doesn’t just exist, it grows at every step.
Monte Carlo Approximation: M
M parallel trajectories
The stochastic rollout captures the right uncertainty, but one trajectory is just one sample from the joint distribution. To approximate the full distribution, you run M
M independent trajectories.
Imagine 500 people in a room, each holding a copy of the same observed history on a piece of paper. At this moment, all 500 papers are identical.
Round 1: everyone feeds the same history into the model. Since the inputs are identical, everyone gets the same (
μ
1
,
σ
1
)
(mu_1, sigma_1). Now each person rolls their own dice, drawing a random sample from N
(
μ
1
,
σ
1
2
)
mathcal{N}(mu_1, sigma_1^2). Person 1 gets 0.41. Person 2 gets 0.62. Person 3 gets 0.55. All different numbers, because each is a separate random draw from the same bell curve. Each person writes their number at the end of their paper. The papers are no longer identical.
Round 2: each person feeds their own paper into the model. Person 1’s paper ends in 0.41, person 2’s ends in 0.62, just different inputs produce different (
μ
2
,
σ
2
)
(mu_2, sigma_2) for each person. Each rolls their dice again. The papers now differ in the last two values.
Round 3, 4, 5, …H
H: same thing. At every round, the papers diverge further because each person’s context is shaped by all their previous random draws.
After H
H rounds, you have 500 different possible futures. They started identical (same real history) and diverged because each person rolled their own dice at every step. This divergence is the uncertainty propagation and the amount they’ve spread apart by round H
H is the honest forecast uncertainty at that horizon.
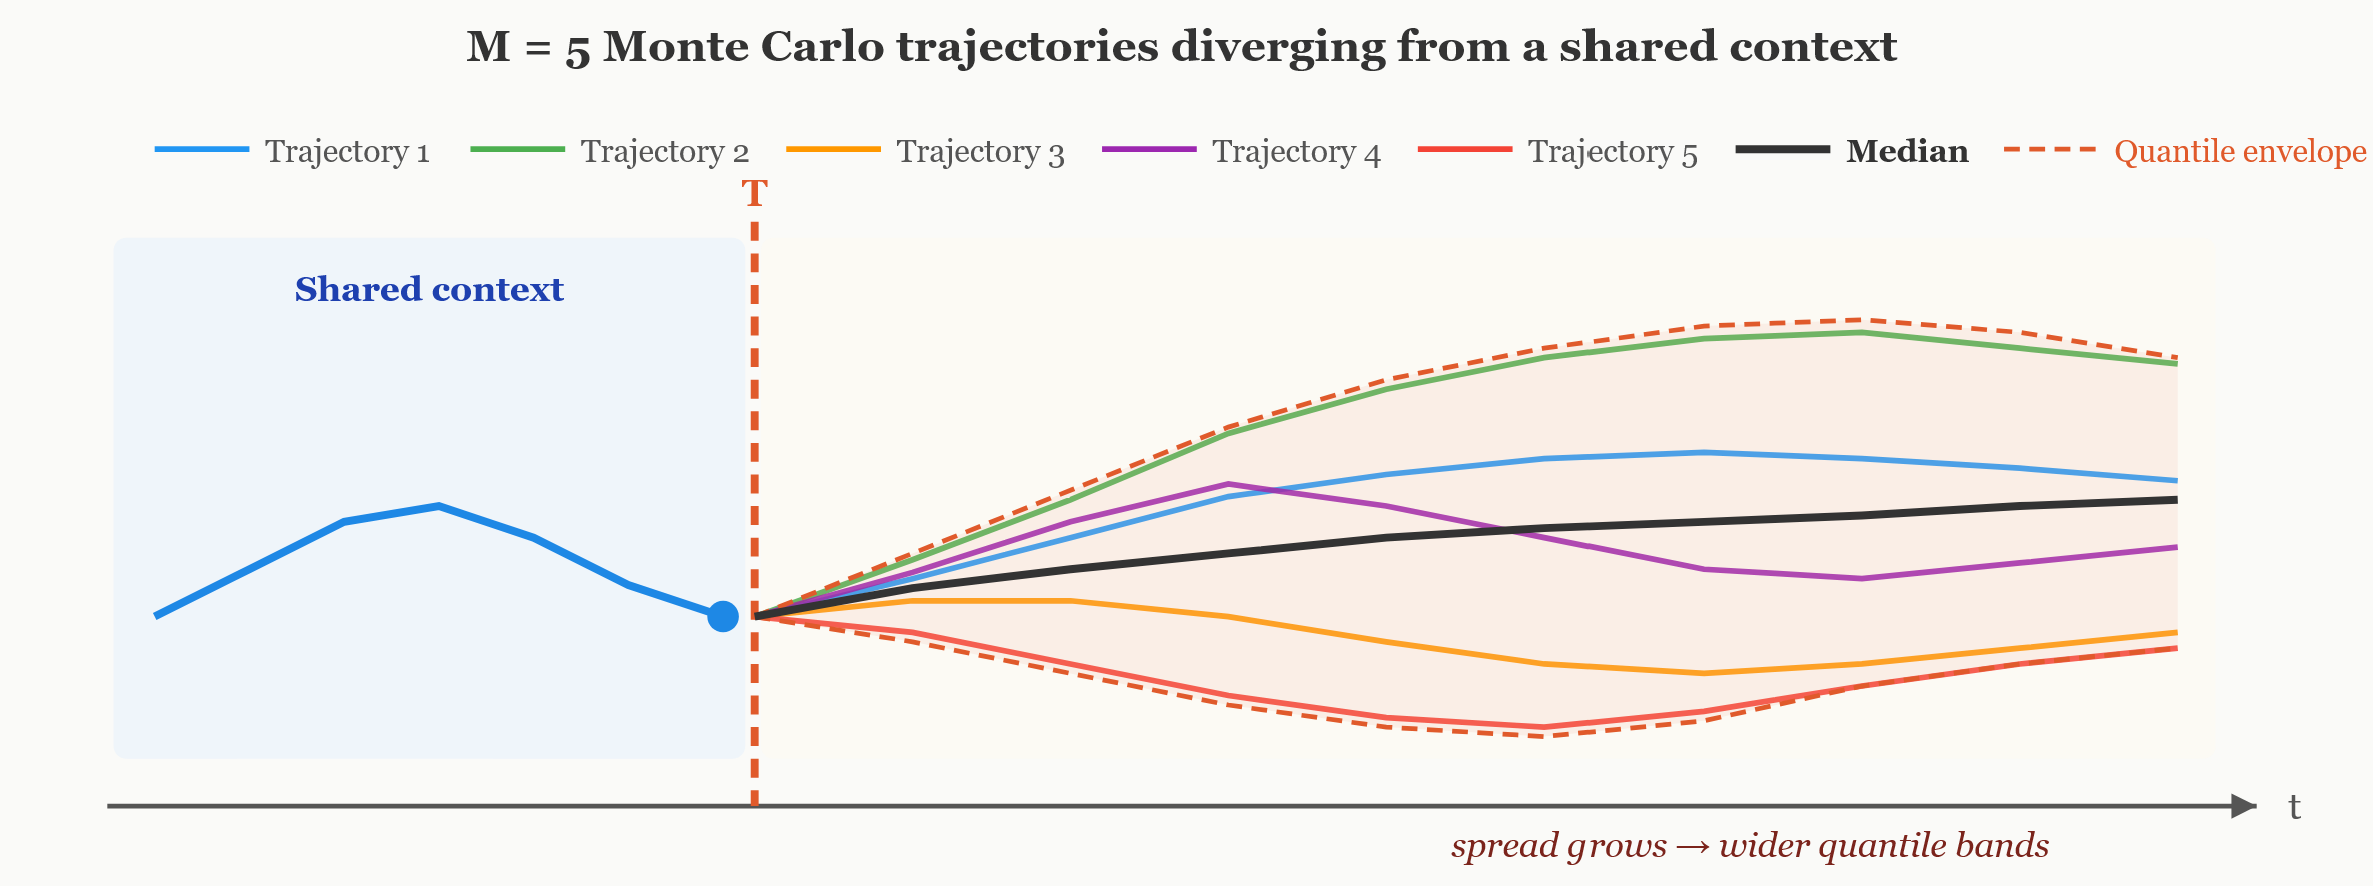
Monte Carlo approximation of stochastic rollout.
This procedure is the Monte Carlo approximation of the joint distribution. You can’t write that distribution down in closed form, since the model is a nonlinear neural network, but you can sample from it exactly through the stochastic rollout. Each trajectory follows the chain rule factorisation we wrote earlier, sampling from the correct one-step conditional at every step. With enough samples, you can estimate any property of the joint distribution you want: means, quantiles, exceedance probabilities, whatever.
How many is enough?
The estimation error shrinks as O
(
1
/
M
)
O(1/sqrt{M}). In practice:
-
For the median (central forecast): M
=
20
M = 20 to 50
50 is usually enough. The median converges fast because it only needs the rough middle of the distribution. -
For the 5th or 95th percentile (tail behaviour): you need more. At M
=
50
M = 50, the 5th percentile is approximately the 2nd or 3rd smallest value out of 50 one different random draw shifts it a lot. For reliable tail estimates, M
=
200
M = 200 to 500
500 is safer. -
For coverage checks across many test examples: moderate M
M per example 50
50–100
100) is fine, because averaging across test cases smooths the noise.
The cost is linear: M
M trajectories meansM
M forward passes per horizon step. But with batching, processing all M
M contexts as a single batch, as in the code above, this is one GPU kernel launch per step, not M
M separate calls. On the synthetic signal from Part I, 500 trajectories over 50 steps runs in seconds on a CPU.
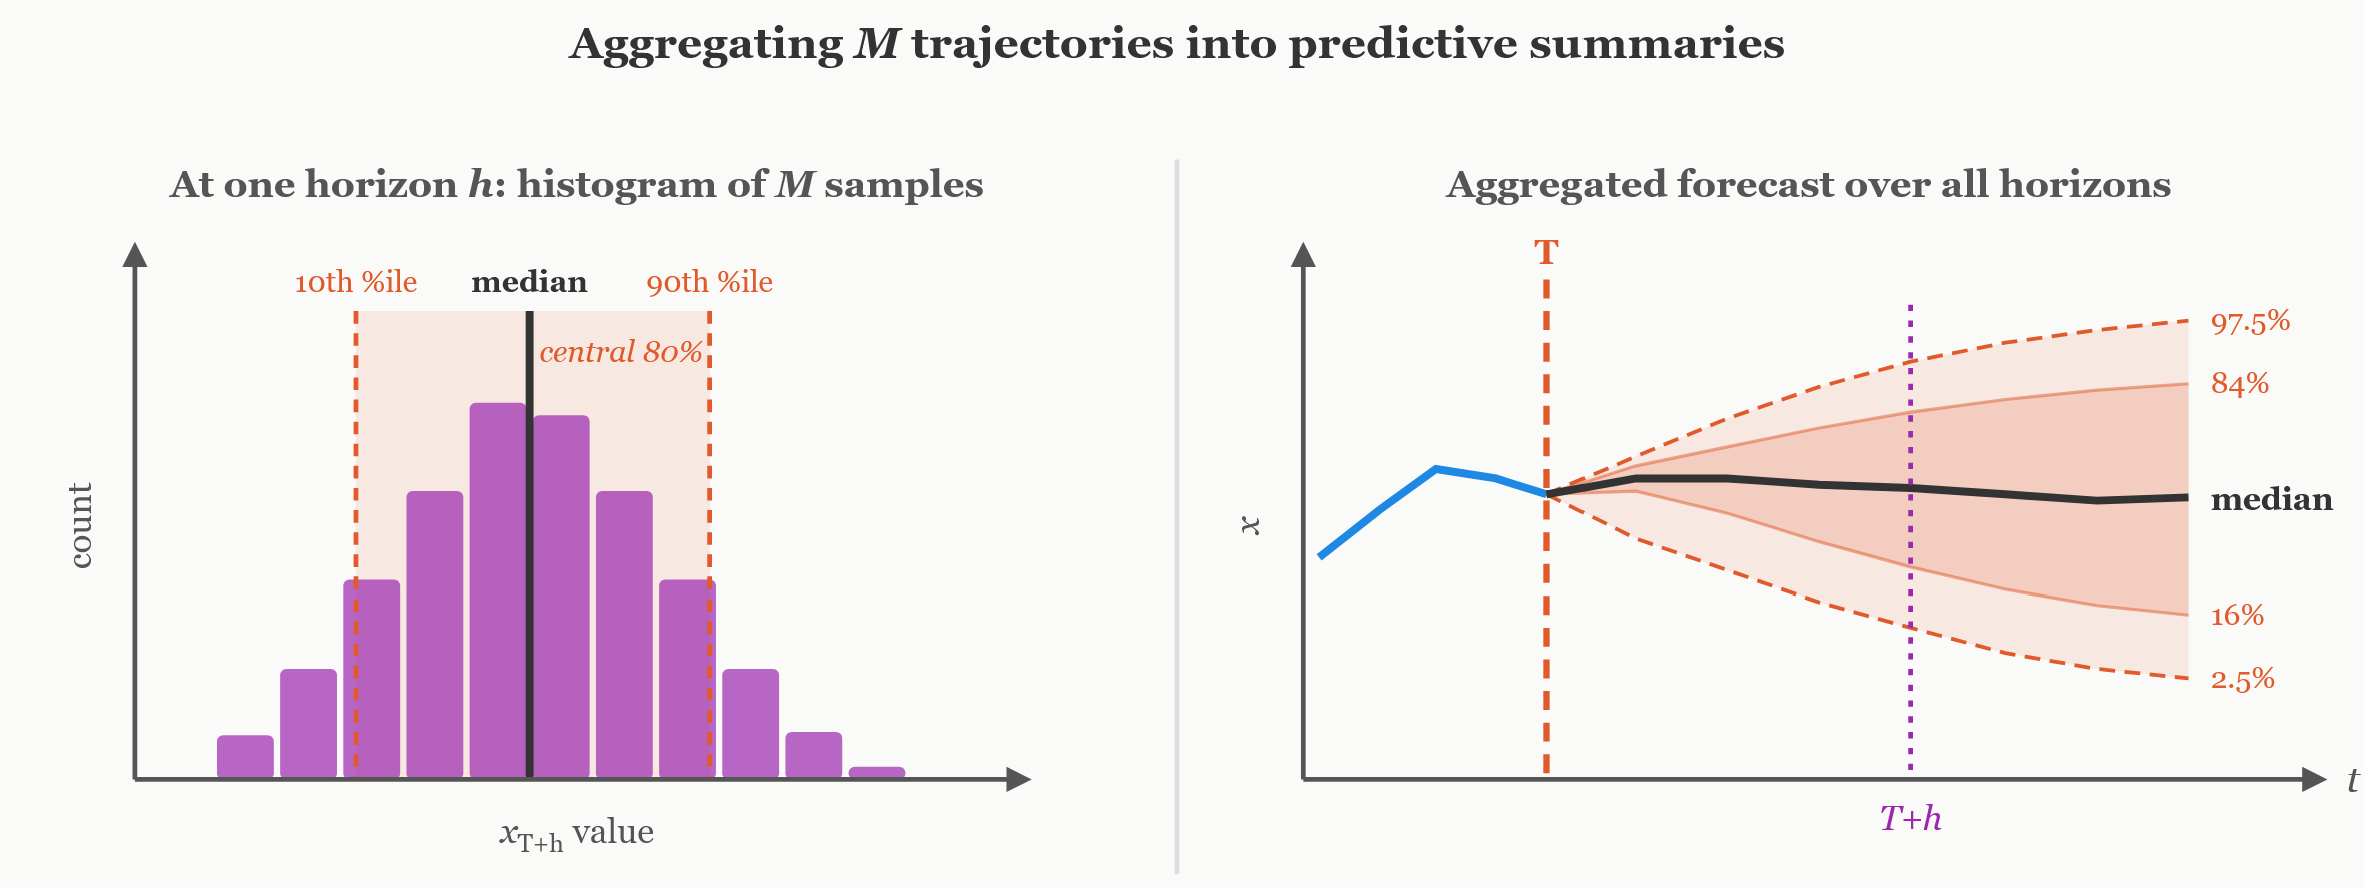
From trajectories to a forecast
You have a matrix of shape M
×
H
M times H: row m
m is one trajectory, columnh
h is one horizon step. How do you turn this into a usable forecast?
The central forecast: the median. At each horizon step, take the median across trajectories:
x
^
T
+
h
=
median
(
x
~
h
(
1
)
,
x
~
h
(
2
)
,
…
,
x
~
h
(
M
)
)
hat{x}_{T+h} = text{median}(tilde{x}_h^{(1)},, tilde{x}_h^{(2)},, ldots,, tilde{x}_h^{(M)})
Why median and not mean? If a few trajectories wander off to extreme values (it happens, especially at long horizons), the mean gets pulled toward them. The median doesn’t care, it just looks at the middle. For symmetric distributions both are equivalent, so there’s no cost in switching.
Uncertainty bands: quantiles. Sort the M
M values at each step. The band between the (
α
/
2
)
(alpha/2)-th and (
1
−
α
/
2
)
(1 – alpha/2)-th percentiles is a prediction interval at level 1
−
α
1 – alpha. For a 90% band, take the 5th and 95th percentiles.
median_forecast = np.median(trajectories, axis=0) # (H,)lower_90 = np.percentile(trajectories, 5, axis=0) # (H,)upper_90 = np.percentile(trajectories, 95, axis=0) # (H,)No Gaussian assumption here. You’re not computing μ
±
1.645
σ
mu pm 1.645sigma. You’re reading directly from where the trajectories actually went. If the distribution at some horizon step is skewed or heavy-tailed, the quantile band reflects that automatically.
Exceedance probabilities. Remember the alarm threshold τ
tau from Part I? With M
M trajectories, estimating the probability of crossing it is tricross τ
tau at some point during the horizon, your estimated exceedance probability is 7%. No closed-form integral needed
The key property of all these summaries: at early horizon steps, the trajectories cluster tightly, so bands are narrow. At late horizon steps, the trajectories have fanned out, so bands are wide. The widening happened naturally from the compounding randomness, you didn’t tune anything, you just sampled honestly.
QA the forecast I: the coverage-horizon plot
One example is anecdotal. The real test: run both rollout strategies from many starting points in the test set, and check whether the 90% band actually contains the true value about 90% of the time, at every horizon step.
For each test window i
i with true future x
T
+
1
(
i
)
,
…
,
x
T
+
H
(
i
)
x_{T+1}^{(i)}, ldots, x_{T+H}^{(i)}, compute the band from each strategy and check:
inside
h
(
i
)
=
1
[
q
^
0.05
(
h
,
i
)
≤
x
T
+
h
(
i
)
≤
q
^
0.95
(
h
,
i
)
]
text{inside}_{h}^{(i)} = mathbf{1}!left[hat{q}_{0.05}^{(h,i)} ;leq; x_{T+h}^{(i)} ;leq; hat{q}_{0.95}^{(h,i)}right]
Average over all test windows:
cov
^
(
h
)
=
1
N
test
∑
i
=
1
N
test
inside
h
(
i
)
widehat{text{cov}}^{(h)} = frac{1}{N_text{test}}sum_{i=1}^{N_text{test}} text{inside}_{h}^{(i)}
For a calibrated forecast, cov
^
(
h
)
≈
90
%
widehat{text{cov}}^{(h)} approx 90% at every horizon h
h.
Now plot cov
^
(
h
)
widehat{text{cov}}^{(h)} as a function of h
h coverage on the y
y-axis, horizon on the x
x-axis. This single plot tells you almost everything:
-
Flat line near 90%: the rollout is well calibrated. The bands are honest at every horizon. This is what you want.
-
Line that drops ash
hgrows: the bands are too narrow at long horizons. The model is overconfidentabout the distant future. This is the classic signature of deterministic rollout, it misses the propagated uncertainty, so even by step 50 the band is far too tight. -
Line that rises ash
hgrows: the bands are too wide. The model is overly cautious.
In the companion notebook, the contrast is stark. The deterministic rollout’s coverage crashes below 50% within a few steps and keeps falling, by step 50, it’s barely above chance. The stochastic rollout holds roughly stable across the full horizon. Same model, same context, same trained weights, one line of code changed. That one line, replacing mu with sample in the context append is the difference between a forecast you can trust and one that’s silently lying about its confidence.
QA the forecast II: the PIT histogram
The coverage plot tells you “are the bands the right width?” The Probability Integral Transform (PIT) tells you something richer: is the entire predicted distribution correct, not just the width?
For each test window i
i and horizon step h
h, compute the fraction of trajectories that fell below the true value:
u
h
(
i
)
=
1
M
∑
m
=
1
M
1
[
x
~
h
(
m
,
i
)
≤
x
T
+
h
(
i
)
]
u_h^{(i)} = frac{1}{M}sum_{m=1}^{M} mathbf{1}!left[tilde{x}_h^{(m,i)} leq x_{T+h}^{(i)}right]
This is the empirical quantile of the truth within the ensemble. If the truth landed right in the middle, u
≈
0.5
u approx 0.5. If almost all trajectories were below the truth, u
≈
1.0
u approx 1.0.
Key property: if the ensemble is perfectly calibrated, u
u should be uniformly distributed on [
0
,
1
]
[0, 1]. The truth should land in the bottom 10% of trajectories about 10% of the time, in the middle 10% about 10% of the time, in the top 10% about 10% of the time. Collect u
u values across all test windows and all horizons, and plot a histogram. The shape is the diagnosis:
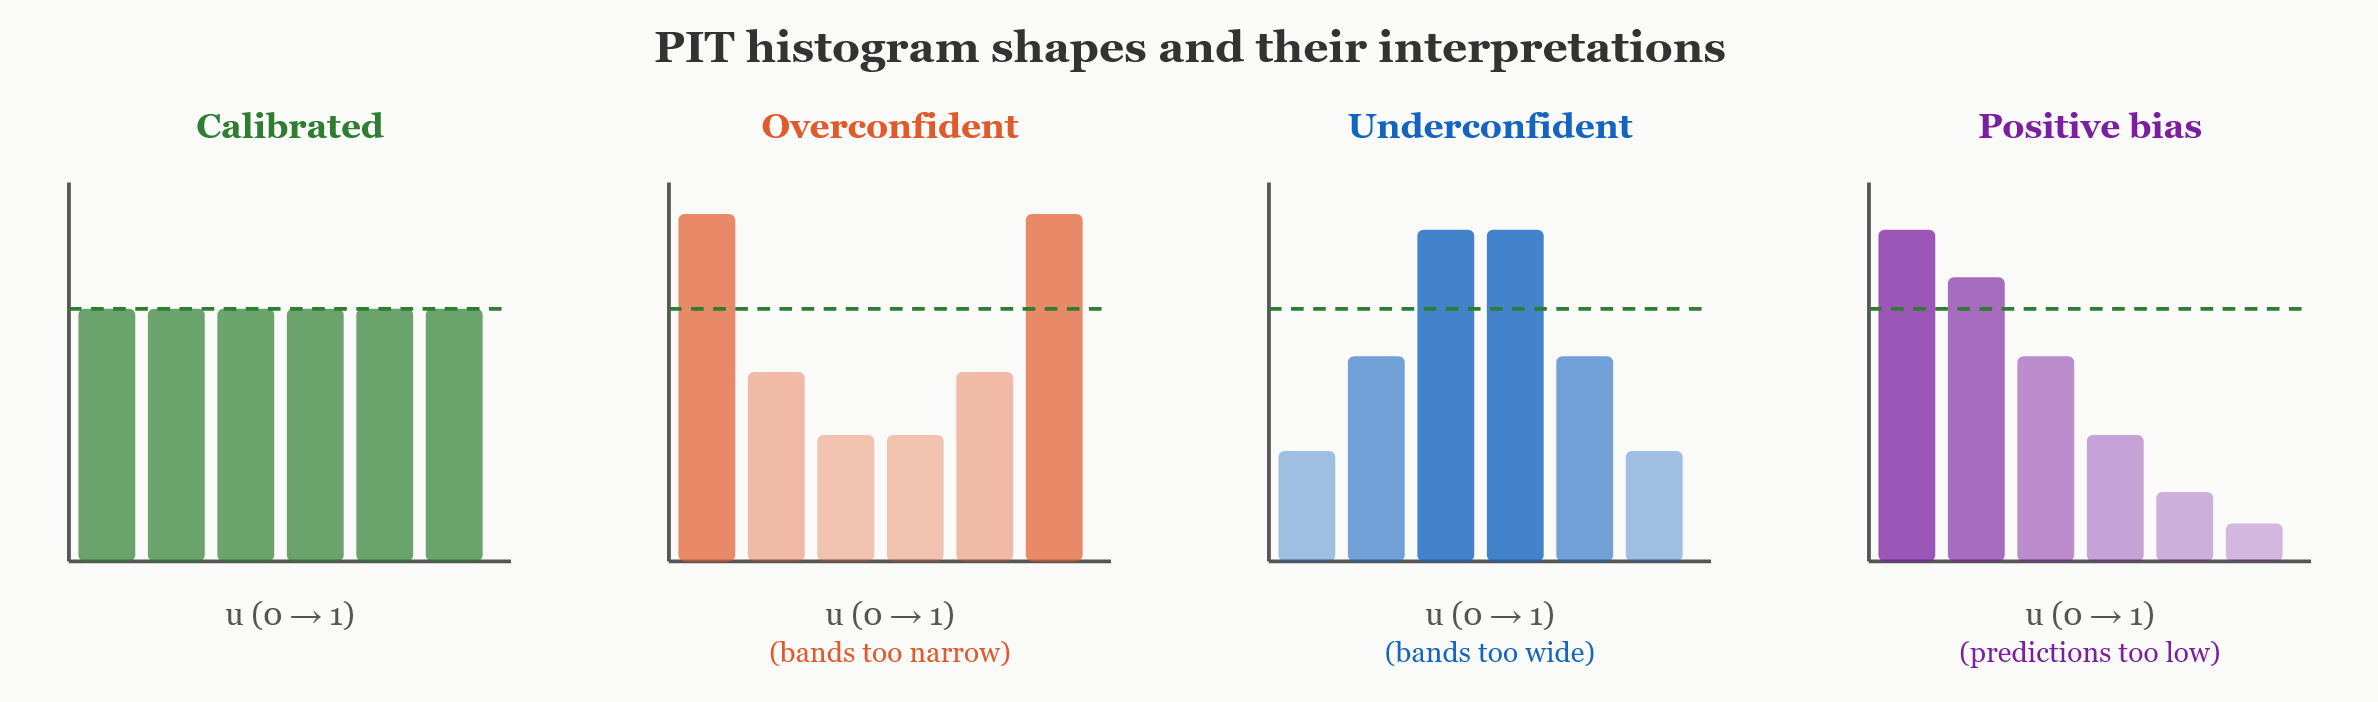
PIT histogram shapes
One histogram, four possible diagnoses. In the accompanying notebook, the deterministic rollout produces a dramatic U-shape, the truth is in the extreme tails far more often than it should be, because the bands are too narrow. The stochastic rollout is much flatter.
Practical Considerations
Keep the clamp during rollout
During rollout, the model feeds on its own outputs, data it never saw during training. This is distribution shift: the inputs look different from training data because they’re the model’s own predictions, not real observations.
In this unfamiliar setting, σ
sigma can drift to extreme values. Without the same log
σ
logsigma clamp used during training, a single unlucky trajectory might produce a wild sample that drives σ
sigma to zero (infinite confidence, gradient explosion) or infinity (total ignorance) at the next step. That corrupts the trajectory, and if it happens early, every subsequent step is garbage. The fix is actually tri
log_sigma = torch.clamp(log_sigma, min=-5.0, max=2.0)If this clamp is already in your model’s forward() method (as it should be from Part I), you don’t need to change anything. Just don’t remove it for inference.
Some architectures include multi-step prediction heads(such asDeepSeekorSeismoGPT), auxiliary outputs that directly predict the distribution at horizons 2, 3, …, H
H from the current context, without rolling out. These are useful during training as regularisers and give fast marginal distributions at each horizon. But marginal is the key word. A marginal distribution at step h
h tells you the spread of x
T
+
h
x_{T+h} by itself. It does not tell you how x
T
+
3
x_{T+3} relates to x
T
+
2
x_{T+2}, or how they move together. There’s no joint distribution, no coherent trajectories.
Only the autoregressive stochastic rollout produces a joint distribution, actual sequences where each step depends on the previous one. That’s what you need for:
-
Coherent trajectory sampling (a single plausible future)
-
Exceedance probabilities over windows of time (“will the threshold be crossed sometime in the next hour?”)
-
Correct quantile bands that account for compounding uncertainty
The right approach: use the single-step head plus Monte Carlo rollout for inference. Treat multi-step heads as training auxiliaries, not inference tools.
Batching is key for speed
The stochastic rollout processes all M
M trajectories as a single batch of shape (
M
,
T
)
(M, T) one forward pass per horizon step. This is important. M
M separate forward passes of shape (
1
,
T
)
(1, T) would give the same result but be dramatically slower, especially on a GPU where the kernel launch overhead dominates for small models.
On the synthetic signal from Part I (transformer with 32-dimensional embeddings, 2 layers, 4 heads), 500 trajectories over 50 steps runs in about 2 seconds on a CPU. Scaling to real models and longer horizons, the batched approach stays efficient.
What this does not guarantee
The stochastic rollout propagates uncertainty correctly, but only the uncertainty the model has learned to express. If the one-step model is miscalibrated (its σ
sigma is systematically too small or too large), the rollout faithfully propagates that miscalibration. Garbage in, garbage out.
This is why the diagnostics from Part I still matter. The one-step model must be well calibrated first, honest σ
sigma at every individual step, before rolling it forward. The coverage-horizon plot and PIT histogram then tell you whether the rollout introduced additional problems on top of that.
There’s also the question of distribution shift during rollout: the model was trained on windows of real data, but during multi-step inference it’s feeding on its own predictions. If the model’s predictions drift for example, if the mean trajectory slowly diverges from the true signal dynamics, the later context windows look increasingly unlike anything the model saw during training. The model might still output reasonable-looking (
μ
,
σ
)
(mu, sigma), but the quality degrades. This is a real problem, especially at very long horizons, and it’s why multi-step training losses (training the model on its own rollout outputs, not just on real data) can help.
There’s also a deeper assumption we haven’t questioned: the predictive distribution at each step is Gaussian. The rollout propagates whatever the one-step model outputs, but if the true noise is skewed, heavy-tailed, or multimodal, even a perfectly calibrated Gaussian is fitting the closest bell curve to a non-bell-curve reality. The mean and variance might be right, but the shape is wrong and shape matters for tail probabilities and threshold crossings.
We’ll revisit these concerns in future articles.
···
Conclusion
One-step prediction gives you a distribution over one value. Multi-step prediction needs a distribution over entire sequences. The chain rule says you can build it one step at a time, but only if you propagate uncertainty correctly through the chain.
Deterministic rollout (feed μ
mu back) treats each intermediate prediction as certain. This captures only the local noise at each step and ignores the inherited uncertainty from all previous steps. The law of total variance guarantees that this underestimates the true forecast variance, and the underestimation compounds at every step. Coverage degrades with horizon.
Stochastic rollout (sample and feed back, M
M times) lets uncertainty compound naturally through the autoregressive loop. Different trajectories diverge because of the randomness at each step, and the spread of the ensemble at any horizon step reflects both the local noise and all the accumulated propagation. Coverage stays honest.
The difference in code is one line. The difference in forecast quality is fundamental.
The coverage-horizon plot and the PIT histogram are the tools that tell you whether your multi-step forecast is calibrated. They apply regardless of the model architecture, the distribution family, or the signal domain. If you’re producing probabilistic forecasts at any horizon longer than one step, you need both.
And there’s a deeper point here. We started this series asking “should I worry about this prediction?” Part I gave the model a voice, a way to express uncertainty at a single step, through σ
sigma. Part II gave that voice a memory, a way to carry uncertainty forward over an extended future, through stochastic sampling. But listen to what that voice is actually saying. At every step it says: “I think the next value is drawn from a bell curve with this center and this width.” A bell curve. Symmetric, unimodal, light-tailed.
Some signals don’t fit that shape. For instance, a seismic signal can have sudden regime changes that create multimodal futures. For all of these, a single Gaussian per step is too rigid, no matter how well you propagate it. That’s where richer predictive distributions, quantized tokens, mixture models, flow matching become essential. The rollout machinery stays exactly the same (sample and feed back, M
M times), but the one-step distribution becomes expressive enough to capture the full complexity of what might happen next. That’s where the next part of this series begins.
References
[1] M. Seitzer, A. Tesch, N. Rasiwasia and G. Martius, On the Pitfalls of Heteroscedastic Uncertainty Estimation with Probabilistic Neural Networks (2022), ICLR 2022
[2] W. Esmail, S. Russell, J. Klinge, A. Kappes and C. Thomas, Data-Driven Forecasting of three-Component Seismograms Using Transformer Architectures (2026), arXiv:2606.02912
