

Abstract
Health queries are among the most common uses of consumer conversational artificial intelligence (AI), yet little is known about how this usage varies across countries and what characteristics are associated with it. Here we analysed 1.7 million de-identified health-related conversations from Microsoft Copilot across 109 countries and regions, examining two dimensions: intensity (the share of all conversations that are health-related) and composition (the distribution across eight user-intent categories). We find that these dimensions have largely non-overlapping predictors. A consistent development gradient is associated with a shift in the query mix from broad health informational intents to specific clinical and system-navigation intents in wealthier, older-population countries, while lower population-level confidence in hospitals was the strongest predictor of health conversation intensity (r = −0.41, P < 0.001), though this association is more conditional on specification. These patterns suggest that conversational AI usage is associated with the structure and perceived quality of national health ecosystems. Moreover, these findings present additional perspectives as to how conversational AI systems can be leveraged to better meet specific population needs and augment their health and wellbeing.
As consumer-facing applications of conversational artificial intelligence (AI) become routine sources of information, health information seeking has emerged as a common personal use case1. Recent work indicates people increasingly use general purpose conversational AI to ask about symptoms, medications, medical procedures and health system navigation2,3. Despite these findings, and while the impacts of AI have been researched broadly4, little is known about how usage differs across countries and which country-level characteristics are associated with it.
Cross-country studies undertaken before the popularization of conversational AI show that online health information seeking varies with demographics, health system engagement and national context5. Broadly, health information-seeking behaviours differ based upon an evolving combination of national (digital infrastructure and health-system structures) and individual (socio-economic status as well as attitudes towards medical institutions and technology) factors6,7. In particular, trust in healthcare systems varies across countries, even after accounting for individual-level demographics8. This cross-country variation in institutional trust may extend to the willingness of populations to engage with new health information sources. A recent 30-country survey shows that trust in healthcare providers generally exceeds trust in government or family and friends and that acceptance of AI-generated health content differs widely: exceeding 75% in China, India, Pakistan and Indonesia while falling below 50% in countries including Canada, the UK, Sweden, Japan and Russia9,10.
Emerging data from AI developers indicates that health-related conversational AI use is a notable component of affective and support-seeking interactions11,12. Cross-country differences are visible in volume and categories of use, with work from Anthropic suggesting that users in the USA are overrepresented in medical guidance requests compared with the global average13. Similarly, conversational AI usage for health-related queries remains heavily concentrated in high-income countries, with low-income countries accounting for less than 1% of global GPT traffic14, and recent survey evidence suggests substantial cross-country gaps in general AI adoption15,16.
Moreover, the quality of AI-generated medical recommendations varies by user location17. This pattern aligns with wider health-seeking population surveys, in which lower health system trust and cost barriers are associated with increased self-directed information-seeking behaviour6,18,19,20. Taken together, these suggest that conversational AI use for health queries is potentially associated with access to technology and local health-systems features. However, the relative weight of these factors and the quantity and content of AI conversations for health has not been analysed at a cross-country level.
In this Article, we examine how country/region and population-level characteristics are associated with the intensity and characteristics of conversational AI system use for health queries and whether cross-country patterns align with prior literature on health information seeking before widespread adoption of conversational AI. We examine usage across two dimensions. The first is intensity, defined as the share of all AI conversations in a country or region that are health-related. The second is composition, defined as the distribution of health conversations across eight user-intent categories ranging from generic informational queries, symptom understanding, to health system-navigation tasks.
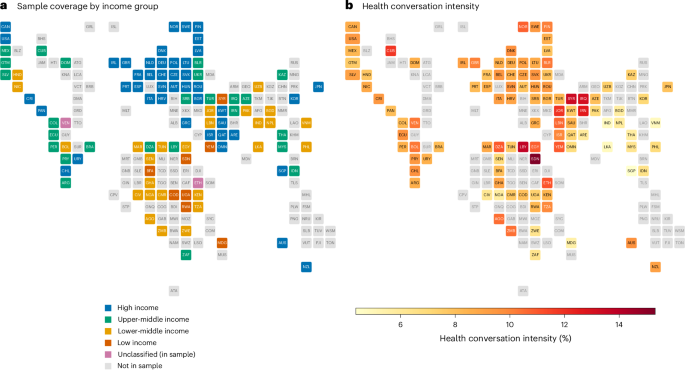
Our analysis is based on 1.7 million health-related conversations from consumer Microsoft Copilot, collected between January and March 2026 from across 109 countries and regions (Fig. 1). We aggregate these conversations to the country/region level and regress health conversation intensity and eight intent shares on 14 country-level predictors drawn from six public sources, which are entered in three hierarchical blocks (‘development and demographics’, ‘health system’ and ‘Institutional and trust’). The design is cross-sectional, observational and ecological (that is, all variables are measured at the country/region level). As such, all reported associations should be interpreted as conditional correlations rather than causal effects or individual-level relationships. In other words, they describe countries and regions, not the individuals within them.
a, Countries/regions included in the sample, coloured by World Bank income group29. b, Health conversation intensity, defined as the share of all Copilot conversations that are health-related in each country/region. Each tile represents one country/region (N = 109, with 105 displayed on the grid). Four territories are absent from the tile layout: Hong Kong SAR, Puerto Rico, State of Palestine and Taiwan. Ethiopia and Venezuela lack a current World Bank income classification. Tile grid layout based on the geofacet R package38.
We find that intensity and composition have largely non-overlapping predictors. Low confidence in hospitals is the strongest predictor of intensity (β = − 0.49, P < 0.05) but does not predict intent composition (that is, what these conversations are about). Instead, health system structure predicts composition: countries with higher universal health coverage have substantially more of their health conversations about medical paperwork tasks (β = 0.91, P < 0.001) and a development gradient is associated with a shift in the query mix from broad informational queries towards specific navigational and symptom-related ones as gross domestic product (GDP) and population age increase.
We contribute to the literature in two ways. First, while other literature15 has documented cross-country variation in firm- and worker-level AI adoption, we provide a large-scale cross-country analysis of conversational AI usage for health-related queries, covering 109 countries/regions and 1.7 million conversations. Prior work on this has focused on classification of consumer conversations within the USA only, with emerging descriptive summaries of health queries but not how country-level characteristics are associated with population-level patterns of AI health usage21. Second, we document that the relationship between access to healthcare services and the use of conversational AI systems for health-related topics is reflected in two distinct dimensions: institutional trust predicts the country-level intensity of conversational AI use for health, while access to services predicts its composition.
Results
We organize our results around the two dependent variables: (1) the share of AI conversations devoted to health (intensity, Fig. 1b) and (2) the distribution of those conversations across intent categories (composition). For each, we present a regression model identifying which of the country-level characteristics predict it. Table 1 reports hierarchical regressions for intensity (N = 93), and Table 2 reports the corresponding models for eight intent shares. Robustness checks using alternative merge methods (Supplementary Tables 5–6), false discovery rate (FDR)-corrected P values (Supplementary Table 7), variance inflation factors (Supplementary Appendix section 3), and influential observation diagnostics (Supplementary Fig. 1) appear in the Supplementary Information. Across these checks, the composition associations are shown to be more robust, surviving FDR correction and showing robust effects across most alternative merge methods. Conversely, the intensity–trust association meets our robustness criteria but is more sensitive to specification. As such, the former composition result is best understood as being supported by strong, and the latter by moderate, evidence.
Health conversation intensity
Confidence in hospitals shows the strongest bivariate correlation with health conversation intensity (r = −0.41, 95% confidence interval (CI) −0.56 to −0.23, N = 100, P < 0.001; Supplementary Table 4): countries where a smaller share of the population reports confidence in hospitals have a larger share of their AI conversations that are health-related. Further, mobile subscriptions (r = −0.29, 95% CI −0.46 to −0.11, N = 108, P = 0.002) and AI readiness (r = −0.27, 95% CI −0.43 to −0.08, N = 107, P = 0.005) are also negatively associated with intensity, while urban population (r = 0.20, 95% CI 0.01 to 0.37, N = 108, P = 0.039), physicians per 1,000 people (r = 0.25, 95% CI 0.06 to 0.42, N = 103, P = 0.011) and government effectiveness (r = −0.23, 95% CI −0.40 to −0.04, N = 108, P = 0.017) also cross the significance threshold. On the other hand, most development and health system indicators, including GDP, internet users and the WHO Universal Health Coverage (UHC) index, show near-zero correlations with intensity. This pattern suggests that general economic development alone does not predict consumer health AI usage.
Our hierarchical regression model outlined in the ‘Empirical strategy’ section in the Methods explains roughly half the cross-country variation in intensity (R2 = 0.532, adjusted R2 = 0.441; Table 1). Overall, institutional and trust characteristics, not broader development indicators, contribute the most additional explanatory power beyond baseline demographics: block 1 (development and demographics) accounts for an R2 of 0.281, though note that no individual predictor reaches significance under HC3 standard errors. Adding block 2 (health system) increases R2 by 0.109, with government health expenditure as a share of GDP reaching significance in the full model (β = 0.46, 95% CI 0.07 to 0.86, z = 2.28, P = 0.022). Lastly, block 3 (institutional and trust) adds the largest increment over block 1 (ΔR2 = 0.141). Overall, our main finding is that confidence in hospitals is the strongest individual predictor in the full model (β = −0.49, 95% CI −0.89 to −0.10, z = −2.43, P = 0.015; P < 0.001 under ordinary least squares (OLS) standard errors).
The negative association between confidence in hospitals and conversational AI usage for health-related intent suggests that countries with lower institutional trust show higher AI health usage. Both confidence in hospitals and government health expenditure are significant in two of the four merge specifications (Supplementary Table 5), with the direction and approximate magnitude of both coefficients remaining stable across all four methods. Substituting the Wellcome Global Monitor 2020 confidence measure for the 2018 measure yields a coefficient in the same direction (Supplementary Appendix section 10), though it is not statistically significant.
Figure 2 shows the country-level pattern: countries where fewer people express confidence in hospitals (for example, Iraq, Iran, Algeria and Libya) cluster at the high end of AI health usage, while countries with high confidence (for example, India, Singapore, Malaysia and Thailand) cluster at the low end. In practical terms, a one-standard-deviation decrease in confidence in hospitals (roughly 13 percentage points) is associated with approximately a 1 percentage point increase in health conversation intensity, with point estimates ranging from −0.18 to −0.49 across the four merge specifications.
a, Health conversation intensity, the share of all Copilot conversations that are health-related, plotted against confidence in hospitals, the share of respondents reporting confidence in hospitals in their country6 (N = 100; Pearson r = −0.41, 95% CI −0.56 to −0.23, P < 0.001). b, Selected bivariate relationships between country-level predictors (from Table 2) and intent shares, with Pearson r and N reported. Top: the development gradient, plotting GDP per capita (current international dollars at purchasing power parity (PPP), log scale) against health information and education (i), research and academic support (ii) and healthcare navigation (iii) are shown. Bottom: three intents paired with their strongest non-GDP bivariate correlate: physicians per 1,000 with fitness and lifestyle (iv), social protection coverage with emotional wellbeing (v) and population 65+ with healthcare navigation (vi). Each point represents one country/region, labelled by ISO 3166-1 alpha-3 code; the dashed lines show OLS fits. All reported correlations are Pearson correlations, and all corresponding significance tests are two-sided. Pairwise N ranges from 103 to 108 depending on data availability. Every correlation shown is significant at ***P < 0.001.
Intent composition
Hospital confidence does not reach significance for any of the eight individual intent shares (Table 2). Rather, intent composition is associated primarily with development and health system characteristics.
The bivariate correlations show a consistent development gradient across intents (Supplementary Table 4). Health information and education and research and academic support, the two largest categories, correlate negatively with most development indicators, with the strongest associations in the range of r = −0.50 to −0.65 (P < 0.001). Symptom questions, fitness and lifestyle, and healthcare navigation display the reverse pattern, with the strongest positive correlations reaching r = 0.46 to 0.75 (P < 0.001). The strongest individual associations are internet users with fitness (r = 0.75, 95% CI 0.66 to 0.83, N = 106, P < 0.001), UHC index with Fitness (r = 0.74, 95% CI 0.64 to 0.82, N = 106, P < 0.001) and AI readiness with healthcare navigation (r = 0.72, 95% CI 0.61 to 0.80, N = 107, P < 0.001). Medical paperwork is the exception, with near-zero correlations with most development indicators (population 65+: r = 0.01, internet users: r = 0.05). This pattern suggests medical paperwork intent is associated with a different set of country characteristics.
The hierarchical regressions are consistent with these findings (Table 2 and Fig. 3). Model fit ranges from adjusted R2 = 0.337 for medical paperwork to 0.760 for healthcare navigation, with block 1 (development and demographics) accounting for the explained variance in six of the eight intents, with GDP (log) and population 65+ as the most consistently significant predictors. Healthcare navigation is the best-predicted intent, with four predictors reaching PFDR < 0.05: GDP (log) (β = 0.66, 95% CI 0.30 to 1.02, z = 3.61, P < 0.001, PFDR < 0.01), population 65+ (β = 0.69, 95% CI 0.39 to 1.00, z = 4.45, P < 0.001, PFDR < 0.001), AI readiness (β = 0.44, 95% CI 0.18 to 0.69, z = 3.34, P < 0.001, PFDR < 0.01) and the quadratic GDP term (β = 0.36, 95% CI 0.11 to 0.61, z = 2.80, P = 0.005, PFDR < 0.05).
N = 93, corresponding to Table 2. Points show standardized OLS coefficients (β), the point estimate and measure of centre, for all 15 predictors, and the horizontal whiskers show 95% CIs based on HC3 robust standard errors. Predictors are grouped by block and ordered consistently across all tables. Within each predictor row, the eight markers denote the eight intent-share outcomes, with the legend outlining colour and shape. Filled markers denote P < 0.05 and open markers P ≥ 0.05.
In raw terms, for a country with average income, a one-standard-deviation increase in log GDP is associated with a 0.7 percentage point increase in the Healthcare navigation share, roughly a 30% increase relative to the sample mean of 2.3%. The other two robust predictors of this intent are comparable in magnitude: a one-standard-deviation increase in the population aged 65+ (about 8 percentage points) corresponds to a 0.7 percentage point higher share (about 32% of the mean) and a one-standard-deviation increase in AI readiness (about 17 points on the 0–100 score) to a 0.5 percentage point higher share (about 20%). GDP (log) and population 65+ also predict higher symptom questions (β = 0.90, 95% CI 0.27 to 1.53, z = 2.81, P = 0.005, PFDR < 0.05 and β = 0.55, 95% CI 0.16 to 0.94, z = 2.78, P = 0.005, PFDR < 0.05, respectively) and lower research and academic shares (population 65+: β = −0.43, 95% CI −0.75 to −0.10, z = −2.59, P = 0.010, PFDR < 0.05). The picture that emerges from Table 2 is a gradient from broad health literacy queries in lower-income, younger-population countries towards specific, personal health management queries in higher-income, older-population countries. Health information and education, the largest category at 43% of health conversations, is the notable exception to this pattern of clear individual predictors. Block 1 explains half its variance (R2 = 0.510), yet no single predictor reaches significance under HC3 standard errors, suggesting that many correlated development indicators share explanatory power without any one dominating.
Medical paperwork is the one intent where the development gradient breaks down. Block 1 explains the least variance for this intent (R2 = 0.113), and block 2 (Health system) adds the largest increment of any intent (ΔR2 = 0.247). The UHC index is the single largest coefficient in our main analysis (β = 0.91, 95% CI 0.46 to 1.37, z = 3.92, P < 0.001, PFDR < 0.001) and health expenditure per capita is also positively associated in the primary specification (β = 0.33, 95% CI 0.10 to 0.56, z = 2.80, P = 0.005, PFDR < 0.05), though this coefficient does not reach significance under the alternative merge methods.
In practical terms, a one-standard-deviation increase in UHC index (roughly 14 index points) is associated with a 4.0 percentage point increase in the medical paperwork share, over half the sample mean of 7.0%. This pattern is consistent with a difference in where the relative unmet needs of individuals lie, that is, where more structured health systems leave users with higher administrative burden and medical paperwork. On the other hand, trust in doctors/nurses points the other way, where lower trust is associated with more paperwork-related queries (β = −0.41, 95% CI −0.73 to −0.10, z = −2.55, P = 0.011, PFDR > 0.05), but this association is not robust enough to be conclusive.
Health expenditure per capita has a different role for other intents. Countries with higher health spending have a smaller share of health conversations about fitness and lifestyle (β = −0.31, 95% CI −0.45 to −0.16, z = −4.15, P < 0.001, PFDR < 0.001) and symptom questions (β = −0.40, 95% CI −0.74 to −0.06, z = −2.28, P = 0.023, PFDR > 0.05). This negative association is consistent with better-funded primary care being associated with lower use of AI for symptom-checking and lifestyle advice. GDP (log) is also positively associated with fitness and lifestyle (β = 0.53, 95% CI 0.13 to 0.92, z = 2.59, P = 0.010, PFDR < 0.05), which indicates that the positive development gradient and the negative health expenditure association operate simultaneously.
Emotional wellbeing is one of the few intents for which block 3 (institutional and trust) contributes the most incremental variance (ΔR2 = 0.073, compared with 0.015 for block 2). Social protection coverage is its strongest bivariate correlate (r = 0.62, 95% CI 0.49 to 0.73, N = 104, P < 0.001), but the coefficient does not reach significance in the full model. The UHC index is negatively associated (β = −0.55, 95% CI −1.03 to −0.07, z = −2.25, P = 0.025, PFDR > 0.05). These patterns are suggestive but not robust enough to be conclusive. Figure 2 illustrates these two patterns. Figure 2b(i)–(iii) shows the development gradient, where higher GDP is associated with a gradient from broad informational queries to specific navigational ones. Figure 2b(iv)–(vi) shows that non-GDP predictors, including physician density, social protection and population age, track distinct intent categories.
Discussion
Our study shows that institutional trust and health system structure predict different dimensions of conversational AI use for health, and the two sets of predictors are largely non-overlapping. Confidence in hospitals predicts how intensively AI is used for health at the country level but has little bearing on intent composition. The composition of queries is instead predicted by development indicators and health system structure, variables that have comparatively little role in overall volume. This suggests that aggregate usage measures may obscure meaningfully distinct phenomena. These dimensions also differ in the relative levels of evidence that support them. We treat the composition result, which survives FDR correction and holds across most alternative merge methods, as being supported by strong evidence. The intensity result, on the other hand, clears our robustness bar and is directionally stable across all other analyses but is nonetheless more sensitive to specification, which is why we treat it as being supported by moderate evidence.
The trust–intensity relationship we observe is consistent with a broader country-level pattern where lower institutional confidence is associated with greater use of conversational AI as an alternative source of health information, such as offline hospital bypass22. Because our data are aggregated to the country level, this describes countries and not individuals and does not establish that the same people who distrust hospitals are those using AI. Countries in which fewer people express confidence in hospitals use conversational AI tools more intensively for health queries, even when controlled for other country-specific characteristics. The intensity regression identifies confidence in hospitals as the strongest bivariate correlate (r = −0.41, P < 0.001) and the strongest predictor in the full model, with a standardized coefficient larger in magnitude than any other predictor (β = −0.49, P < 0.05). In practical terms, a one-standard-deviation decrease in confidence in hospitals (roughly 13 percentage points) is associated with approximately a 1 percentage point increase in health conversation intensity, an 11% increase relative to the sample mean of 8.7%. The coefficient remains negative across all four merge specifications, with the point estimate ranging from −0.18 to −0.49, and no single country drives the result in the leave-one-out analysis.
Confidence in hospitals does not, however, predict what people ask AI about, as it fails to reach significance for any of the eight individual intent shares. The main pattern is thus solely related to the overall volume of health-related AI usage rather than in specific intents. Trust in doctors and nurses is not significant for intensity (β = 0.31, not significant). This distinction may suggest that the pattern operates at the level of institutional confidence rather than interpersonal trust in health professionals, though the ecological design means we cannot confirm that the same individuals who distrust hospitals are the ones using AI for health. More broadly, negative healthcare experiences and medical mistrust have been associated with greater intentions to seek health information online, particularly among individuals with chronic conditions23.
The composition of AI health queries follows a different logic. Across most intent categories, we observe a development gradient, where in lower-income countries with younger populations, health conversations are concentrated in broad informational categories (health information and education, research and academic support), which together account for over 55% of health queries. In countries with higher GDP and older populations, the share of these broad categories is lower and specific health management queries (symptom questions and healthcare navigation) are more common. Healthcare navigation is the best-predicted intent in our analysis (adjusted R2 = 0.760), with GDP, population 65+ and AI readiness all reaching significance, even after FDR correction. This pattern is consistent with AI use, in more developed countries, more for tasks that presuppose existing engagement with a health system, such as understanding symptoms before a visit or navigating referral pathways, rather than for general health literacy.
Medical paperwork is the exception, as health system variables provide the dominant explanatory power and not the development gradient, with UHC showing one of the largest associations in our analysis (β = 0.91, P < 0.001). The pattern suggests that the relative unmet need surrounding administrative demands of structured health systems exceeds other clinical needs. The scale of such administrative work is substantial in many countries such as the USA, where 73% of insured adults perform at least one healthcare administrative task annually24.
Countries with structured health systems therefore appear to use AI primarily as a tool for navigating the bureaucratic layer those services create. However, other factors might also contribute to greater patient use of AI for medical paperwork queries, such as increased digital integration of healthcare services or greater patient engagement with the available systems. These need not reflect a higher administrative burden. Instead, they may instead indicate a setting in which patients are better equipped to navigate a structured healthcare system, and our data cannot distinguish between these accounts.
An interpretive concern with the intent-level regressions is that several categories are behaviourally heterogeneous: the same query type can reflect complementarity depending on the user’s orientation towards the formal health system or a different type of pattern. Symptom questions, for example, could index a user self-diagnosing in lieu of a clinician they cannot access. Emotional wellbeing queries could reflect a response to unmet mental health needs or between-session support. Because the intent label does not distinguish these orientations, a regression of any single dual-use intent share on macro indicators mixes opposing mechanisms and produces coefficients that are difficult to interpret cleanly.
To address this, we construct a complementarity ratio of system-dependent intents (medical paperwork and healthcare navigation) to dual-use intents (symptom questions and emotional wellbeing). See Supplementary Appendix section 9 for full details. Regressing the log-transformed ratio on the same 15 predictors, we find that UHC index is the strongest predictor (β = 0.88, P < 0.001) and confidence in hospitals is positively associated (β = 0.38, P < 0.01), indicating that countries with more structured health systems and higher institutional trust have AI health profiles oriented more towards system-dependent use. These associations hold across three alternative specifications of the ratio.
Taken together, these patterns suggest that AI health usage is associated with the structure and effectiveness of a country’s health system. Institutional trust, health system structure and economic development predict largely non-overlapping dimensions and the fact that they predict different dimensions of AI health use suggests that aggregate measures of usage would obscure meaningful variation in how AI is used for health across different country contexts.
Several features of our design constrain interpretation. The cross-sectional nature of the data precludes causal inference: the association between confidence in hospitals and AI health usage could reflect reverse causality, and unobserved country-level factors such as cultural attitudes towards technology, disease burden and media environment could confound any of the reported associations. Relatedly, our design allows us to observe conversational AI usage and does not directly measure unmet need, barriers to care or other health outcomes. Moreover, with 15 predictors estimated on our set of 93 countries and regions and with several intercorrelated indicators, individual coefficients should be interpreted cautiously. We thus base our conclusions on the associations that remain robust across our set of robustness checks and diagnostics, rather than on every significant coefficient.
Our data capture usage of a single AI platform, Microsoft Copilot, whose users may not be representative of national populations. Within any one country, users who turn to Copilot for health may differ systematically from the wider public on age, education, occupation, income, digital literacy, attitudes towards technology and other related topics. Because our data are fully de-identified, we cannot test for this and reweight it towards the general population. In addition, the health conversation intensity measure is a share of Copilot conversations, not a population-level rate, such that countries with high intensity may simply have user bases that are more health-oriented. Relatedly, because the denominator is the total volume of Copilot conversations, intensity might be mechanically lower in countries where Copilot usage tends to skew towards non-health uses such as work and coding, and this skew might be more pronounced in wealthier and information-heavy economies. Including GDP, internet penetration and AI readiness allows us to partially address this, as they proxy for cross-country differences driving the work/coding usage mix, though within-country selection and residual denominator effects may remain. Because our composition measures are shares within health conversations, they are less sensitive to the overall size and selection of the user base than absolute volumes. This general selection concern is partially mitigated by the 1,000-conversation threshold, but cannot be eliminated without individual-level analysis.
The more serious concern is differential selection, where the degree of selection may vary alongside the very characteristics we study. For example, if the Copilot user base is more or less socioeconomically privileged in lower-income countries, this may result in a bias of the cross-country associations. Thus, we interpret our results as primarily patterns among Copilot users at the country level and caution against extrapolating them to entire populations. More broadly, the ecological design means that country-level associations should not be interpreted as individual-level relationships: a country with low hospital confidence and high AI health usage does not imply that the individuals who distrust hospitals are those turning to AI. Within-country variation in both trust and AI access is probably substantial.
Our intent classification relies on an automated taxonomy with clinician-validated accuracy of 84% accuracy on the English-language dataset2, introducing measurement error that could attenuate associations or, if misclassification correlates with country characteristics, create spurious patterns. Because privacy constraints prevented analysis of the original-language logs, we could not verify whether classifier accuracy varies across individual countries. Overall, we do not believe this materially changes the core findings from our study given the increasingly performant multilingual capabilities of large language model (LLMs) and our focus on the largest and most robust country-level differences for our main findings. In addition, because any such classification concern would operate via the source language, which is correlated with development indicators, our set of controls (for example, GDP, internet penetration and AI readiness) is likely to absorb a substantial part of it.
Moreover, two of our key predictors, confidence in hospitals and trust in doctors/nurses, come from the 2018 Wellcome Global Monitor, creating an 8-year gap with our 2026 Copilot data. This raises the question of whether our associations accurately reflect current levels of trust. Several pieces of evidence suggest that this gap is less problematic than it may seem. First, we find that cross-country trust is highly stable: the 2018 and 2020 Wellcome measures correlate at r = 0.72, a period including the coronavirus disease 2019 pandemic year of 2020. We also find that the 2018 measure correlates at r = 0.63 with an independent World Values Survey measure of confidence in the health system (see Supplementary Appendix section 10 for these data and additional robustness analyses). Institutional trust thus behaves akin to a relatively durable national characteristic, so the 2018 measure remains a reasonable proxy for the construct in 2026. Moreover, if the measure was a noisy proxy, one would expect the classical measurement error to attenuate the coefficient towards zero, rendering our estimates potentially conservative. However, we cannot fully rule out the possibility that the pandemic has altered trust differentially in a way that is correlated with AI health usage, and we therefore present the trust–intensity association as conditional on this temporal caveat. The pre-AI timing of these measures additionally rules out reverse causation running from AI adoption to the trust measure.
Our findings carry implications along two main dimensions: the relationship between AI and use and formal health system engagement and the societal consequences of that relationship.
If the association between lower hospital confidence and higher consumer conversational AI health usage reflects individual-level behaviour, conversational AI tools may reduce contact with aspects of formal care in low-trust environments, with potential downstream consequences for health screening and preventative interventions typically delivered through routine health system contact. Conversely, conversational AI may function as a complementary layer that supports engagement with formal health systems—for example, bridging access gaps, improving health literacy, supporting user self-advocacy and helping users navigate care pathways that they might otherwise avoid. Our data cannot directly distinguish between these two directions, but the complementarity ratio analysis shows that countries with more structured health systems and higher institutional trust have AI health profiles oriented more towards system-dependent use, consistent with AI functioning as a complement rather than a substitute.
A distributional concern also arises. Prior work suggests that marginalized groups are both more likely to distrust health systems and more vulnerable to the consequences of AI errors, having fewer safety nets and less opportunity to verify clinical recommendations14,17. Consumer medical AI could therefore assist in narrowing inequities in access while potentially widening the risks of inequities in outcome, making equity a design consideration for consumer health AI rather than a post hoc issue. Safety, cultural competence and appropriate handoff to human care must be considered and engineered robustly in system design to avoid replicating pre-existing patterns of health disparities.
More broadly, conversational AI data may have value as an instrument for public health monitoring. Offering a vantage point outside of health systems, it captures insights which would otherwise be missed by traditional methods such as primary care data, or hospital attendance statistics25,26. If AI health usage correlates with perceived gaps in formal care, as our findings suggest, the volume and character of health-related conversations may be a direct signal of residual unmet need2, one whose population-level interpretation will strengthen as adoption broadens. Specifically, intensity may signal the volume of residual unmet need, while intent composition signals its type, and because the two have largely non-overlapping country-level predictors, they may carry distinct information and could also be tracked separately, continuously and at lower latency than survey instruments. Realizing this potential will require longitudinal data tracking countries as AI adoption matures, replication across platforms beyond Microsoft Copilot and linkage to health outcome measures such as screening rates or emergency department visits.
Methods
Copilot data
All data processing occurred within Microsoft-controlled systems. This data analysis study was approved by the Microsoft Research institutional ethics review board (ERP 11041). All data were collected and used in accordance with the Microsoft Privacy Statement.
Our sample comprises 1.7 million health-related conversations drawn from a larger sample of consumer Microsoft Copilot conversations, collected between January and March 2026 across 109 countries and regions. This sample excludes all enterprise, educational and commercial accounts. The sampled conversations represent a subset of total Copilot usage during this period, not the full population of conversations. As a cut-off, we include all countries with at least 1,000 health conversations over the 3-month period. All country and region names displayed in this paper follow ISO 3166-1 conventions (Supplementary Table 1). Figure 1a shows the geographic and income-group coverage of the sample, which spans all World Bank income categories and all major world regions.
Our first dependent variable is health conversation intensity, defined as the share of all Copilot conversations in a country that are health-related
$${I}_{i}=frac{{H}_{i}}{{T}_{i}}times 100$$
(1)
where Hi is the number of health-related conversations, and Ti is the total number of Copilot conversations in country i within the sample. All conversation-level data are aggregated to the country/region level before analysis; no individual- or conversation-level modelling is performed. Figure 1b displays this measure across countries. This intensity score ranges from 4.4% to 15.35 (mean of 8.7%, median of 8.6%), suggesting that health queries constitute a nontrivial share of overall Copilot usage across countries.
For our second dependent variable, we classify each health conversation into one of eight intent categories derived from the 12-category taxonomy developed by Costa-Gomes et al.2, who validated their classifier against clinician annotations at 84% exact-match accuracy. The eight categories range from broad informational queries (health information and education, research and academic support) to specific actionable ones (symptom questions and healthcare navigation). Supplementary Table 2 provides full definitions of all intents used in this study. We retain the eight largest categories, which together account for over 95% of all health conversations. The four excluded categories (coverage and benefits, digital tools and fitness apps, other health/fitness intent, not health) thus account for less than 5% of all queries. We operationalize this second dependent variable as the intent profile of each country, defined as the share of health conversations falling into each of the eight categories.
All Copilot data was de-identified before analysis through the two-stage, privacy-preserving pipeline described previously2, where raw transcripts are first scrubbed of personally identifiable information, then summarized by a large language model into short English-language descriptions that capture topic and intent without reproducing the user’s original words. All subsequent analysis operates on these summaries. Although the data originates in many different countries and languages and the LLM-based classifier may be differentially capable across them, LLMs have shown remarkable capabilities of performing at near-equal levels across many languages, which reduces the possibility of bias27. The list of languages and countries supported in Copilot is available online28.
No human researcher accessed raw conversation content at any point, and no attempts were made to re-identify users or infer individual health status. Moreover, our analysis operates exclusively at the country-level, where all conversation-level data are aggregated to a single set of intensity and intent variables at the country-level.
Secondary data
We merge our set of primary data with 14 country-level indicators from six public sources to characterize each country’s development, health system characteristics and institutional environment. We selected indicators on two criteria: (1) theoretical relevance to cross-country variation in health information-seeking behaviour and (2) broad data availability across the 109 countries/regions in our sample (Supplementary Table 3). Specifically, these variables are drawn from the World Bank World Development Indicators29, the WHO Global Health Observatory30, the Wellcome Global Monitor6, the Oxford Insights Government AI Readiness Index31, the World Bank Worldwide Governance Indicators32,33 and the ILO Social Protection database34.
We organize these variables into three conceptual blocks: block 1 (development and demographics) captures baseline economic and demographic characteristics, including GDP per capita at purchasing power parity, internet users as a share of the population, the share of the population aged 65 years and over, urban population share and mobile subscriptions per 100 people; block 2 (health system) captures healthcare infrastructure and resourcing, including physicians per 1,000 population, the UHC index, health expenditure per capita and government health expenditure as a share of GDP; and block 3 (institutional and trust) captures governance, public attitudes and social context, including the government AI readiness index, government effectiveness, confidence in hospitals, social protection coverage and trust in doctors and nurses. Table 3 reports descriptive statistics for all variables. We match all indicators to countries by ISO code, yielding a consistent cross-country panel for analysis. Most indicators have reference years between 2021 and 2025 (Table 3), but the Wellcome trust and confidence measures were collected in 2018, 8 years before our Copilot data, so these variables capture pre-existing attitudes rather than contemporaneous sentiment.
Empirical strategy
We examine two outcomes: how much countries use AI for health (intensity) and what they ask about (composition). We relate each to 14 country-level predictors entered in three hierarchical blocks. Because these characteristics are measured in different units (dollars, years and percentages), we standardize them, so that coefficients represent the expected change in standard deictor
Formally, with the country/region as the unit of analysis (N = 109, reduced to N = 93 under listwise deletion in our primary merge method), we estimate OLS regressions of health conversation intensity and intent shares (see ‘Copilot data’ section for definition)
$${Y}_{i}=alpha +mathop{sum }limits_{k=1}^{K}{beta }_{k}{X}_{ki}+{varepsilon }_{i}$$
(2)
where Yi is the standardized dependent variable for country i, Xki are the K = 15 standardized predictors (the 14 indicators listed below, with GDP per capita entering as both a linear and a quadratic term), εi is the error term and α is the intercept. Continuous variables are z-scored within the complete-case regression sample (N = 93) before estimation. GDP per capita is log-transformed before standardization to address its right-skewed distribution, with a quadratic term (the square of mean-centred log GDP, itself then z-standardized) to enable nonlinear relationships.
Our secondary indicators span different time periods and reporting frequencies, so we merge them to a single cross-sectional value per country using four temporal aggregation methods. The two ‘recent’ methods assign each country its most recent non-null value, searching backwards from the indicator’s latest available year within a 3- or 5-year window. The two ‘average’ methods compute the arithmetic mean over the last three or five calendar years, requiring at least two of three or three of five non-null values, respectively. We select ‘recent 5-year’ as the primary merge method because it minimizes variable drop-out under the listwise deletion we use in our regressions (N = 93; see Supplementary Appendix section 1 for the 16 excluded countries). Under this method, each country receives the most recent non-null observation available within a five-year window (for example, a country’s physicians-per-1,000 value is the latest available between 2019 and 2023). The three alternative merge methods serve as robustness checks (Supplementary Tables 5 and 6).
Block 1 (development and demographics) includes GDP per capita (log), GDP per capita (log)2, internet users, population 65+, urban population and mobile subscriptions. Block 2 (health system) adds physicians per 1,000, UHC index, health expenditure per capita and government health expenditure (per cent GDP). Block 3 (institutional and trust) adds AI readiness, government effectiveness, confidence in hospitals, social protection and trust in doctors/nurses. This hierarchical structure allows us to assess the incremental explanatory power of health system and institutional characteristics beyond baseline development indicators. We report R2 after each block and the change in R2 (ΔR2) attributable to each added block; all reported coefficients come from the full 15-predictor model, with only the R2 values reflecting the cumulative block sequence. We also report bivariate Pearson correlations alongside the multivariate regressions to provide a transparent picture of unconditional associations as well as our main regression analyses. Standard errors reported in the primary regression analyses (Tables 1 and 2) use the HC3 heteroskedasticity-consistent estimator35. We use HC3 rather than the more common HC0 estimator because Long and Ervin36 show via Monte Carlo simulation that HC0 often results in incorrect inferences when N ≤ 250, whereas HC3 performs well even for samples as small as N = 25. All reported statistical tests are two-sided.
Throughout this Article, we assess robustness in the following ways. First, we re-estimate all models using the three alternative merge methods (recent 3 year: N = 70, average 3 year: N = 36, average 5 year: N = 74; reported in Supplementary Tables 5–6). Second, for the intent share regressions, in which eight dependent variables are tested against the same set of predictors, we report Benjamini–Hochberg37 FDR corrections to account for multiple comparisons (Supplementary Table 7).
Moreover, we also report diagnostic checks for multicollinearity using variance inflation factors (Supplementary Appendix section 3), for influential observations using Cook’s distance (Supplementary Fig. 1a) and for single-country sensitivity using leave-one-out analysis (Supplementary Fig. 1b). We treat a coefficient as a robust finding only if it meets the following criteria: (1) The coefficient must be significant at P < 0.05 under HC3 standard errors in the primary specification. (2) For the intensity regression (single dependent variable), a predictor must be significant at P < 0.05 in the primary specification and reach same-direction significance in at least one of the three alternative merge methods. (3) For the intent share regressions (eight dependent variables), we additionally require that the coefficient survive Benjamini–Hochberg FDR correction. We report coefficients that fall short of these thresholds but flag them explicitly as not robust.
Reporting summary
Further information on research design is available in the Nature Portfolio Reporting Summary linked to this article.
Data availability
The data analysed in this study are derived from de-identified Microsoft Copilot conversation logs. Raw and de-identified conversation-level data cannot be shared publicly due to privacy constraints, internal data-governance policies and the terms under which the data were collected. All conversation data underwent automatic PII scrubbing prior to analysis, and all subsequent processing followed an ‘eyes-off’ model in which no human researcher accessed conversation content. The research dataset retains no persistent user identifiers and will be deleted within 30 days of final publication approval in accordance with internal data-retention requirements.
Code availability
The analysis code is not publicly available. It was developed within Microsoft’s internal infrastructure and relies on proprietary data pipelines and access-controlled systems that cannot be reproduced externally.
References
-
Costa-Gomes, B. & Chen, S. et al. What people do with Copilot. Technical Report, Microsoft AIhttps://microsoft.ai/wp-content/uploads/2025/12/What_people_do_with_Copilot-8.pdf (2025).
-
Costa-Gomes, B. et al. Public use of a generalist LLM chatbot for health queries. Nat. Healthhttps://doi.org/10.1038/s44360-026-00117-x (2026).
-
Pew Research Center. Where do Americans get health information, and what do they trust? Pew Research Centerhttps://www.pewresearch.org/wp-content/uploads/sites/20/2026/04/PS_2026.4.7_health-information_REPORT.pdf (2026).
-
Capraro, V. et al. The impact of generative artificial intelligence on socioeconomic inequalities and policy making. PNAS Nexus3, 191 (2024).
-
Andreassen, H. K. et al. European citizens’ use of E-health services: a study of seven countries. BMC Public Health7, 53 (2007).
-
Wellcome Global Monitor 2018. Wellcome Trusthttps://wellcome.org/reports/wellcome-global-monitor/2018 (2019).
-
Bujnowska-Fedak, M. M., Waligóra, J. & Mastalerz-Migas, A. in Advancements and Innovations in Health Sciences Vol. 1211, 1–16 (Springer, 2019).
-
Zhao, D., Zhao, H. & Cleary, P. D. International variations in trust in health care systems. Int. J. Health Plann. Manage.34, 130–139 (2019).
-
Piltch-Loeb, R. & Wyka, K. et al. A global survey on trust, digital health literacy and health information quality. Nat. Healthhttps://doi.org/10.1038/s44360-026-00102-4 (2026).
-
Busch, F. et al. Multinational attitudes toward AI in health care and diagnostics among hospital patients. JAMA Netw. Open8, e2514452 (2025).
-
McCain, M. et al. How people use Claude for support, advice, and companionship. Anthropichttps://www.anthropic.com/news/how-people-use-claude-for-support-advice-and-companionship (2025).
-
Phang, J. et al. Investigating affective use and emotional well-being on ChatGPT. Preprint at https://doi.org/10.48550/arXiv.2504.03888 (2025).
-
Appel, R. E., McCrory, P., Tamkin, A., McCain, M., Neylon, T. & Stern, M. Anthropic Economic Index Report: uneven geographic and enterprise AI adoption. Technical Report, Anthropichttps://www.anthropic.com/research/anthropic-economic-index-september-2025-report (2025).
-
Chen, H. et al. Large language models and global health equity: a roadmap for equitable adoption in LMICs. Lancet Reg. Health West. Pac.63, 101707 (2025).
-
Bick, A., Blandin, A., Deming, D. J., Fuchs-Schündeln, N. & Jessen, J. Mind the Gap: AI adoption in Europe and the US (NBER, 2026).
-
Abdelwahed, A. E. et al. Public attitudes and practices toward using AI chatbots for healthcare assistance: a multinational cross-sectional study. BMC Health Serv. Res.26, 335 (2026).
-
Gumilar, K. E. et al. Disparities in medical recommendations from AI-based chatbots across different countries/regions. Sci. Rep.14, 17052 (2024).
-
Fox, S. & Duggan, M. Health Online 2013. Technical Report, Pew Research Centerhttps://www.pewresearch.org/internet/2013/01/15/health-online-2013/ (2013).
-
Amante, D. J., Hogan, T. P., Pagoto, S. L., English, T. M. & Lapane, K. L. Access to care and use of the Internet to search for health information: results from the US National Health Interview Survey. J. Med. Internet Res.17, e106 (2015).
-
World Health Organization. Global Strategy on Digital Health 2020–2025https://www.who.int/publications/i/item/9789240020924 (2021).
-
OpenAI. AI as a Healthcare Ally: How Americans are Navigating the System with ChatGPT. Technical Report.https://cdn.openai.com/pdf/2cb29276-68cd-4ec6-a5f4-c01c5e7a36e9/OpenAI-AI-as-a-Healthcare-Ally-Jan-2026.pdf (2026).
-
Xia, J. et al. Mobile phone data show spatial and socioeconomic inequalities in hospital utilization. Nat. Health1, 760–769 (2026).
-
Williamson, L. D. & Prins, K. Uncertain and anxiously searching for answers: the roles of negative healthcare experiences and medical mistrust in intentions to seek information from online spaces. Health Commun.39, 1082–1093 (2024).
-
Kyle, M. A. & Frakt, A. B. Patient administrative burden in the US health care system. Health Serv. Res.56, 755–765 (2021).
-
Ginsberg, J., Mohebbi, M. H., Patel, R. S., Brammer, L., Smolinski, M. S. & Brilliant, L. Detecting influenza epidemics using search engine query data. Nature457, 1012–1014 (2009).
-
Paul, M. J. & Dredze, M. You are what you tweet: analyzing Twitter for public health. Proc. Int. AAAI Conf. Weblogs Social Media5, 265–272 (2011).
-
Hendy, A. et al. How good are GPT models at machine translation? A comprehensive evaluation. Preprint at https://doi.org/10.48550/arXiv.2302.09210 (2023).
-
Microsoft. Supported Regions and Languages in Microsoft Copilot; https://support.microsoft.com/en-us/microsoft-copilot/supported-regions-and-languages-in-microsoft-copilot?utm_
-
World Bank. World Development Indicators; https://databank.worldbank.org/
-
World Health Organization. Global Health Observatory Data Repository; https://www.who.int/data/gho (accessed March 2026).
-
Oxford Insights. Government AI Readiness Index 2025; https://oxfordinsights.com/ai-readiness/government-ai-readiness-index-2025 (accessed March 2026).
-
Kaufmann, D., Kraay, A. & Mastruzzi, M. The Worldwide Governance Indicators: methodology and analytical issues. Hague J. Rule Law3, 220–246 (2011).
-
World Bank. Worldwide Governance Indicators; https://www.worldbank.org/en/publication/worldwide-governance-indicators (accessed March 2026).
-
International Labour Organization. Social Protection Data: SDG Indicator 1.3.1; https://ilostat.ilo.org/data/ (accessed March 2026).
-
MacKinnon, J. G. & White, H. Some heteroskedasticity-consistent covariance matrix estimators with improved finite sample properties. J. Econom.29, 305–325 (1985).
-
Long, J. S. & Ervin, L. H. Using heteroscedasticity consistent standard errors in the linear regression model. Am. Stat.54, 217–224 (2000).
-
Benjamini, Y. & Hochberg, Y. Controlling the false discovery rate: a practical and powerful approach to multiple testing. J. R. Stat. Soc. B57, 289–300 (1995).
-
Hafen, R. geofacet: ggplot2 Faceting Utilities for Geographical Data; https://CRAN.R-project.org/package=geofacet (R Package Version 0.2.2, 2024).
Acknowledgements
We thank the Futures and Health teams at Microsoft AI for their support and contributions to this research. Particularly, we thank H. Richardson for all the guidance and help with the governance of this research. We also thank P. Belem for the invaluable contribution to team spirits.
Funding
No external funding was received for this work.
Authors and Affiliations
Contributions
P.S. and B.C.G. contributed equally: conceptualization, methodology, formal analysis, and writing (original draft). P.T., L.W., X.L., D.M., V.S. and C.K. contributed equally: writing (original draft), conceptualization and methodology. M.B., D.K. and M.S. contributed to supervision and writing (review).
Ethics declarations
Competing interests
All authors are employees of Microsoft. Microsoft develops and operates Copilot, the platform analysed in this study.
Peer review
Peer review information
Nature Health thanks Tien Yin Wong and the other, anonymous, reviewer(s) for their contribution to the peer review of this work. Primary Handling Editor: Lorenzo Righetto, in association with the Nature Health team.
Additional information
Publisher’s note Springer Nature remains neutral with regard to jurisdictional claims in published maps and institutional affiliations.
Supplementary information
Supplementary Figs. 1 and 2, Supplementary Tables 1–8 and statistical calculations, and Supplementary References.
Rights and permissions
Open Access This article is licensed under a Creative Commons Attribution-NonCommercial-NoDerivatives 4.0 International License, which permits any non-commercial use, sharing, distribution and reproduction in any medium or format, as long as you give appropriate credit to the original author(s) and the source, provide a link to the Creative Commons licence, and indicate if you modified the licensed material. You do not have permission under this licence to share adapted material derived from this article or parts of it. The images or other third party material in this article are included in the article’s Creative Commons licence, unless indicated otherwise in a credit line to the material. If material is not included in the article’s Creative Commons licence and your intended use is not permitted by statutory regulation or exceeds the permitted use, you will need to obtain permission directly from the copyright holder. To view a copy of this licence, visit http://creativecommons.org/licenses/by-nc-nd/4.0/.
About this article
Cite this article
Schoenegger, P., Costa-Gomes, B., Tolmachev, P. et al. Global analysis of country-level factors associated with chatbot usage for health.
Nat. Health (2026). https://doi.org/10.1038/s44360-026-00174-2
-
Version of record:15 July 2026
-
DOI
:https://doi.org/10.1038/s44360-026-00174-2
